State of the Venture Capital Industry in 2019
Over the past decade, venture capital funding has risen by 17% annually to a figure of $254 billion. What factors have contributed to this surge and what do they mean for the industry going forward?

This article was originally published on Toptal
The year of 2018 saw a total of $254 billion invested globally into ~18,000 startups via venture capital financing—a 46% leap from 2017’s figures—with 52% ($131 billion) landing in the US alone.
2019 figures are still coming to light, but initial reports show that 2018’s pace has abated to an extent. Crunchbase data shows first quarter deal volumes of $75 billion, a growth of just 6% YoY. The reasoning behind this slowdown points primarily to dampening appetite for Chinese investments. The second and third quarters are historically the most active investing periods, so as the year unfolds, a clearer picture of this trend will appear.
Despite the industry appearing relatively healthy, an unprecedented trend of fewer funded companies, but larger round sizes has emerged. This report takes a comprehensive look at the VC market of 2019 and the macro headwinds behind its current state, followed by the opportunities and threats that loom on the horizon. Because 2019 seems to be bringing an end to the current run in the box set of VC’s annals, the period bookended between Facebook’s 2012 IPO and Uber’s 2019 debut is a fascinating one to look back on.
State of Startup Investment: A Contrast of More Fundraising, but Fewer Deals
Going back to 2008, global annual VC investment sat at $53 billion, which means that there has been a 17% CAGR in financing over the past decade. The etymology of this extended cycle would require its own article, but some catalysts have been:
- $12.3 trillion of quantitative easing since the 2008 Economic Crisis has suppressed fixed income yields leading to a surge in equity investing and the first $1 trillion market cap companies.
- The Web 2.0 “software is eating the world” tech revolution. Bringing investment opportunities through advances in collaborative technologies, mass mobile internet adoption, and erosion of Capex costs via cloud computing.
- An increased governance preference to stay private has given rise to more private rounds and bigger investors choosing private markets over their public counterparts.
The first macro point to highlight about the state of venture capital is that the volume of deals made has fallen from a peak of 20,000 in 2015. Prior to then, the amount invested and volume of deals were seen to be positively correlated events, these have since decoupled. The chart below demonstrates this trend vividly.
Global Venture Capital Financing by Stage: 2010 – 2018
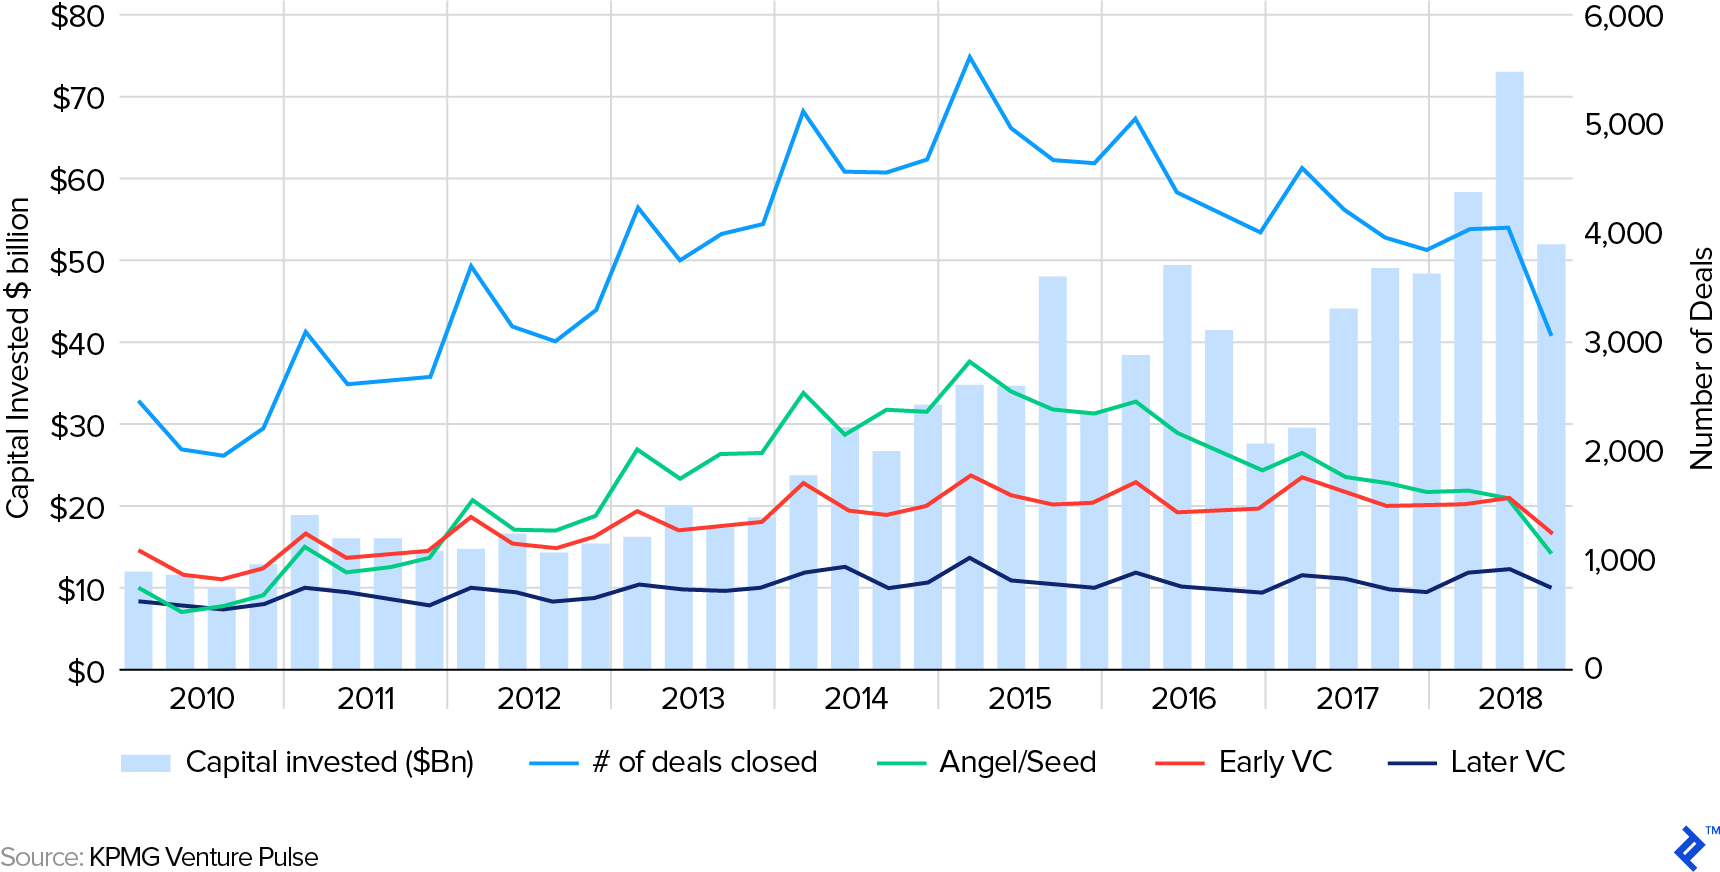
What has transpired has been an unparalleled rise in VC funding dollars, but a fall in investment volume. The proceeding section will explain why this has happened.
1) There Are Less Fundable Startups out There
Americans started more businesses in 1980 than they did in 2013. Over a similar period, the blend of young companies (less than 1 year old) in the economy also fell by 44%. On the startup side, Crunchbase data for the past decade shows that peak startup creation came in 2015. Since then, numbers have halved. Assuming quality has remained the same, this will have contributed to there being fewer startups to seed for interested investors.
Global and Geographic Startup Creation by Year
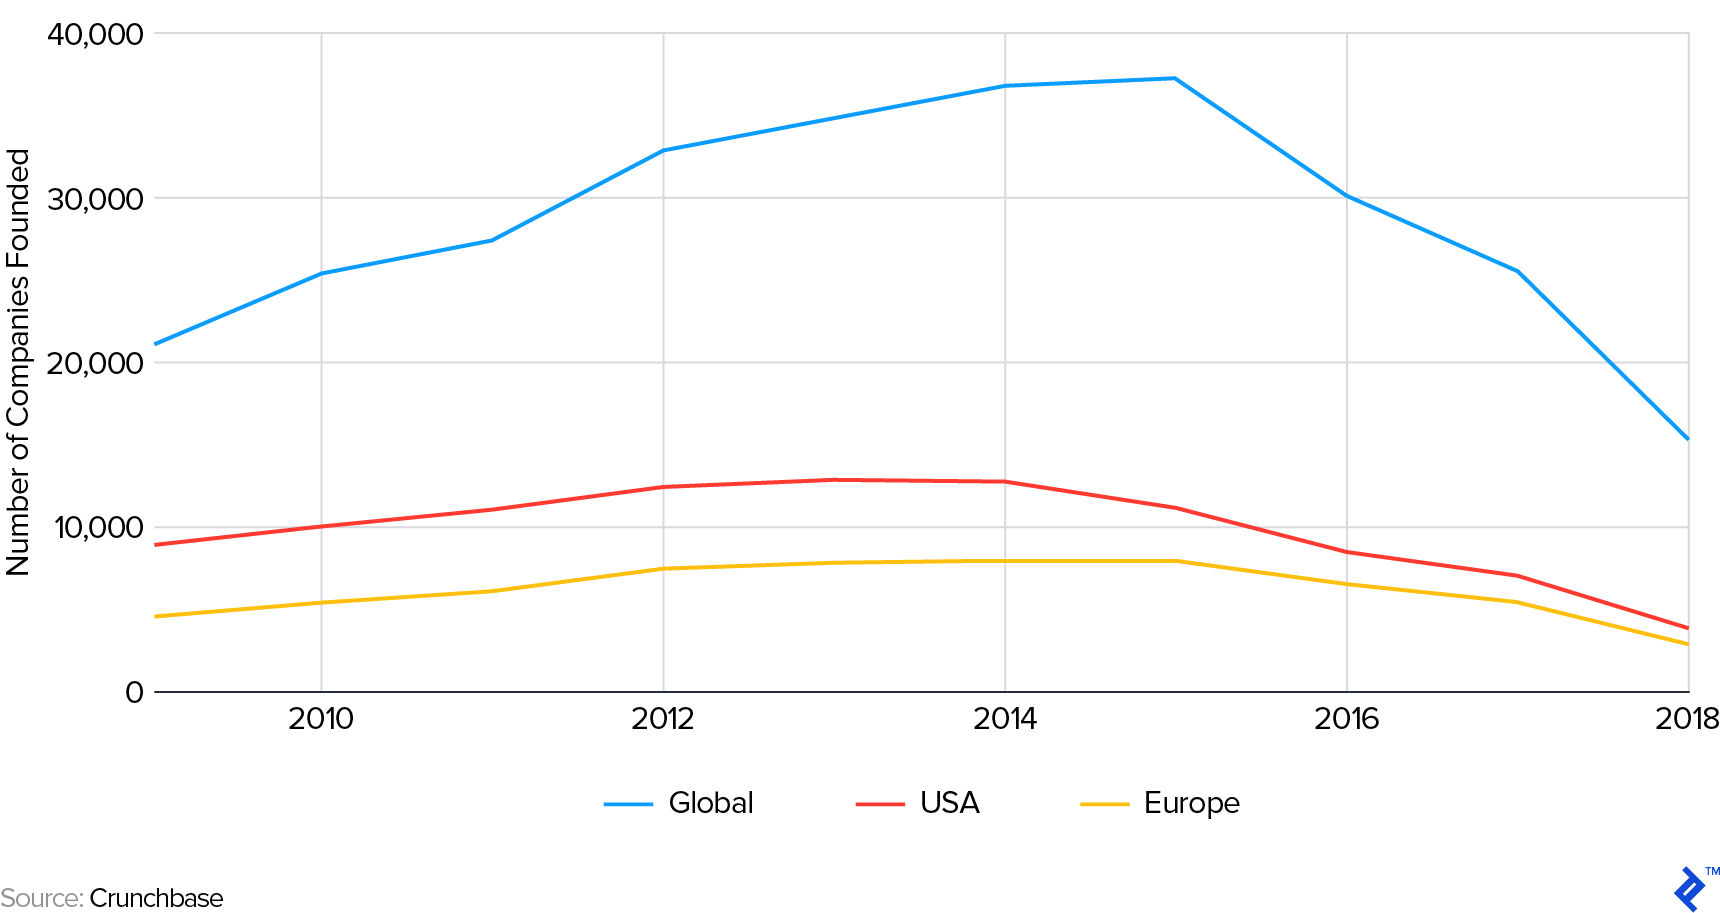
The decline in startups can be attributed to two core reasons:
- The financial reality not matching the romantic, media-fueled perception of contemporary startup culture.
- More streamlined pattern-matching of investors’ interest, which has narrowed focus into concentrated areas.
Modern tools, such as DIY website editors, free cloud storage and social media soapboxes can make it seem tantalizingly easy to start a business. But for many, when faced with the edge of the cliff of jumping in financially, it can be the moment to back out. The Atlantic noted that in a survey of 1,200 millennials by the Economic Innovation Group, more felt that they could have a successful career by staying at one company and climbing the ladder, over founding their own one. Statistics such as this resonate that nowadays the increased press coverage and fêting of entrepreneurs may make it appear that there are more businesses around, but this is still an iceberg’s tip that can blur overall perception.
The “institutionalization” of entrepreneurship is an interesting behavioral trend through more pattern-matching used to judge a startup’s potential for success. This may have resulted in reduced VC funding, due to investor interest being narrowed into specific areas, such as:
- Second-time founders win: Stanford University research states that “the number of prior firms going public [per founder] increases the next firm’s revenues by an average of 115% each.”
- The “Ivy League” fast track: Prestige from an association with renowned investors, or accelerators, can assist a startup’s prospects. For example, Y Combinator accelerated startups are 3x more likely to become unicorns.
- Founder profiling biases: gender, ethnic, geographic and even alma mater investment preference imbalances actually work against VCs, by giving them a smaller sandbox of startup opportunities to pick from.
FALSE POSITIVE MACROECONOMIC DATA
Macroeconomy stats can obfuscate certain points through their all-encompassing generalization of certain factors. Employment and business creation are two such figures, which are popular proxies for venture creation. New business applications reportedly hit a “record high” in the USA in 2018, yet deeper analysis into the definition of this term shows diminished quality: New businesses with “significant” signs of becoming ongoing, wage-paying ventures, have actually fallen since 2005.
USA Business Applications and New Business Formation Statistics

One reason for this could be the increasing popularity of workers shifting into the gig economy, which in turn raises applications for small one-person limited company structures.
2) Investment Standards Have Risen and Become More Concentrated
The fall in seed investing has corresponded with fewer companies—as an overall proportion—making it to Series A rounds. Although, the companies that do raise venture capital financing are raising more money through higher round sizes.
One hurdle contributing to this tighter funnel is the increased performance requirements being sought by investors. Back in 2010, approximately 15% of US Series A invested startups were making revenue, which has now risen to almost 70%. This, in turn, has corresponded with survival rates from Seed to Series A halving, to less than 4%.
Fewer US Startups are Reaching Series A Rounds but More are Generating Revenue

From 2011 to 2018, the median size of Series A rounds grew from $3 million to $8 million, growth which is positively correlated at 0.78 to the increase in time between seed and A rounds for the period. Startups becoming older is evident across the board: In the past decade, the median age of a startup that had raised angel/seed funding rose by over 1 year to 2.85 years. This increased maturity is being instigated by larger investors who are happy to invest larger amounts but are waiting longer to see how the startup’s progression pans out. Startups raising seed rounds inevitably feel this pressure by having to prove traction and product market fit more vividly.
Despite inflation largely being kept in check in the developed world, the 167% increase in median Series A round sizes over the past decade has largely been influenced by a couple of factors: startup ecosystem costs increasing and the winner-take-all mentality of blitzscaling. The latter will be addressed first.
SEIZING MARKETS THROUGH BLITZSCALING
Rapidly capturing markets with large funding reserves has coincided with the rise of “supergiant” funding rounds of over $100 million becoming more popular. Such rounds provide startups with war chests with which to expand, scale, and overwhelm competitors quicker. Within the space of three years, the number of these rounds on a moving average basis has more than doubled from 20 to 50.
Supergiant VC Rounds 2016 – 2018: Number of VC Funding Rounds of Over $100 Million

In addition to raising more money through larger rounds, successful startups are raising more numbers of extension rounds too, which helps to explain absolute VC funding rising, but a falling number of companies being funded.
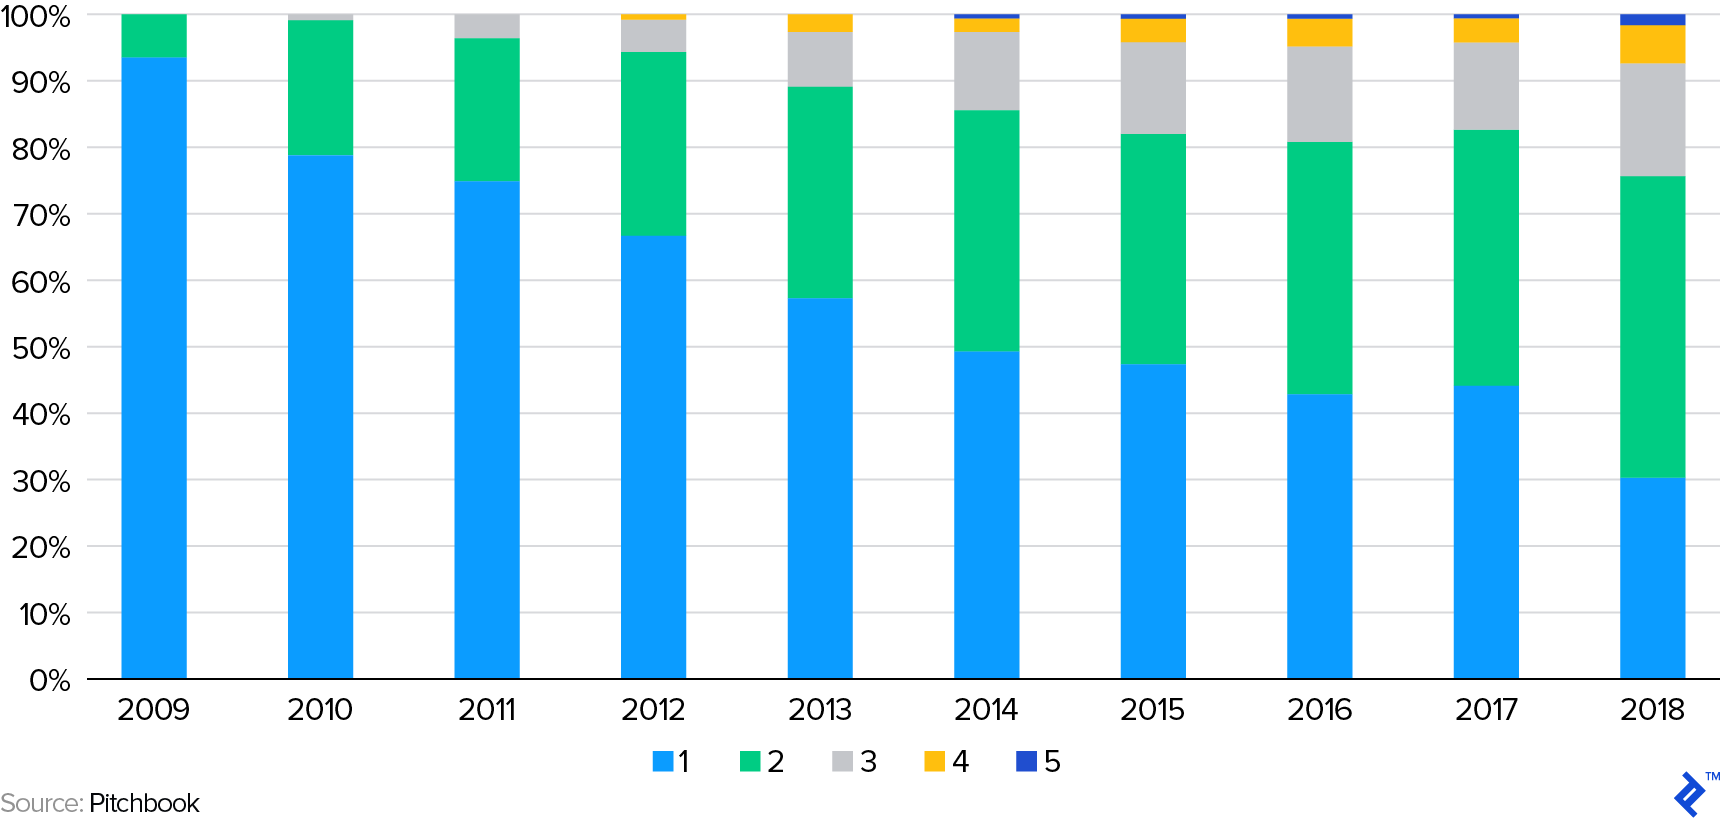
Back in 2009, over 90% of American startups raised just one round prior to their Series A (Pitchbook.) Fast forward 10 years; now the figure is only 30%. The bifurcation of early-stage venture capital rounds into subsets like pre-seed and seed plus has allowed startups to extract more VC funding from increased tactical awareness of getting exactly how much they need, at the right time.
US Series A Startups by Total Number of Rounds Raised Previously, by Year
RESOURCE SCARCITY IS INCREASING OPERATIONAL COSTS
Startup operational costs have increased markedly over the past decade. Through the five years from 2009 to 2014, annual real estate and payroll costs in San Francisco grew by 12% and 15% respectively. Employee costs are driven by the need to find scarce talent, especially in the engineering space. To give context to these figures, across the same period across the whole of the US, real wages fell by 0.20%.
Only in recent years have early education systems began to adapt syllabi to prepare the future workforce for the digital economy. In the UK alone, failure to adapt is estimated to cause a loss of £141.5 billion ($180 billion) to GDP growth. Take a hot area like artificial intelligence; it’s claimed that there are currently fewer than 10,000 people in the world with the necessary skills to undertake serious research in this domain.
3) Inflation from Non-VCs Participating More in Venture Capital Deals
VCs are not the only ones to invest in startups, after the dot-com bubble burst, one third of corporates investing in the space immediately fled. Since then, their quarterly investment has recovered from $848 million globally in Q3 2001 to a high of almost $50 billion by Q2 2018. Along with corporates, there is also significant investment interest from other “outsiders” such as sovereign wealth funds, hedge funds, and endowments. 72% of sovereign wealth funds, for example, now invest in VC deals directly, with their commitments doubling on a yearly basis.
Corporates are the most significant outsider investor and they alone now participate in between 15 – 20% of all venture deals, a 50% increase from five years ago. Part of this rise can be attributed to the Japanese conglomerate Softbank, which has invested almost $70 billion into startups since 2016, through its Vision Fund vehicle.
Corporate VC Quarterly Participation in Global Venture Deals: 2010 – 2018

The increase in investment will have contributed, in part, to the inflation of round sizes, especially from Series A onwards. Corporate VCs tend to focus on startups reaching the scale-up stage because at that point potential impact can be more clearly visualized within the context of their own operations; only ~7% of corporate VC investment goes into seed.
The shift towards increased corporate VC has been driven by a number of factors, some of which are concurrent to the global industry trends mentioned at the beginning:
- Cash balances: Since 2008, corporate balance sheet cash reserves have doubled to over $2 trillion. This all has to get spent somehow. Even share buyback windfalls can recycle into venture capital/equity markets.
- The Disruptive Innovation movement: An acknowledgment that external investment/partnerships are more effective than the ineffective echo chamber of internal R&D labs.
- Financial success: With corporates struggling to innovate and find useful projects, using corporate development teams to invest in startups has shown to offer intangible knowledge transfer and tangible financial benefits. The chart below shows that for the sample surveyed, most units were bringing in compelling returns.
2017 Survey of Financial Returns (Internal Rate of Return) Earned by Corporate Venture Capital Units

It has been shown that corporate VCs can be less price and time sensitive towards venture investing than their closed-ended fund counterparts. Only 40% of corporate VCs actually include financial returns as a metric in employee appraisals. With the invested capital not having hard timelines for being returned and with softer goals being stressed, it would not be radical to suggest that the rise of corporate VC has put upward pressure on round sizes. In 2018, Pitchbook noted that valuations in companies with corporate backers were 2.5x higher than those without.
State of Venture Capital Funds: Returns Steady and Fundraising Up
Previous research into venture capital fund returns has shown that, similar to startup investing, it’s a game of the few haves and the many have-nots. What still persists, though, is the difficulty in tracking a holistic sample set of data to objectively test this hypothesis.
Historically there were four research companies that specialized in tracking aggregate fund returns: Burgiss, Cambridge Associates, Preqin, and Pitchbook. Despite their efforts—along with new upstarts—tracking aggregate returns can be imprecise, for a number of reasons that were summarized in this paper:
- Incomplete data due to privacy pressures on LPs to not report.
- Backfill/survivorship bias where successful funds eventually report and fill in prior returns.
- Inconsistencies from soft reporting commitments from participants.
- Subjective and unchallenged valuation reporting.
Despite the issue of accessing enough data, attitudes towards overcoming it should be pragmatic. A large weight of judgment on the success of the VC asset class should be viewed through the signaling properties of what’s going on day-to-day. If more funds are being raised, more GPs are being lauded and more firms are hiring, then that’s generally a sign that—outside of very perverse incentives—LPs in funds are happy with what they are seeing.
Nevertheless, with the data that is available, the key assertion to be made is that venture capital fund returns are showing strong signs. With the exception of a period in 2016, they have been positive and oscillate around the acceptable par for the course level of a 20% IRR.
Global Venture Capital Industry Rolling One-Year IRR Horizons by Fund Size
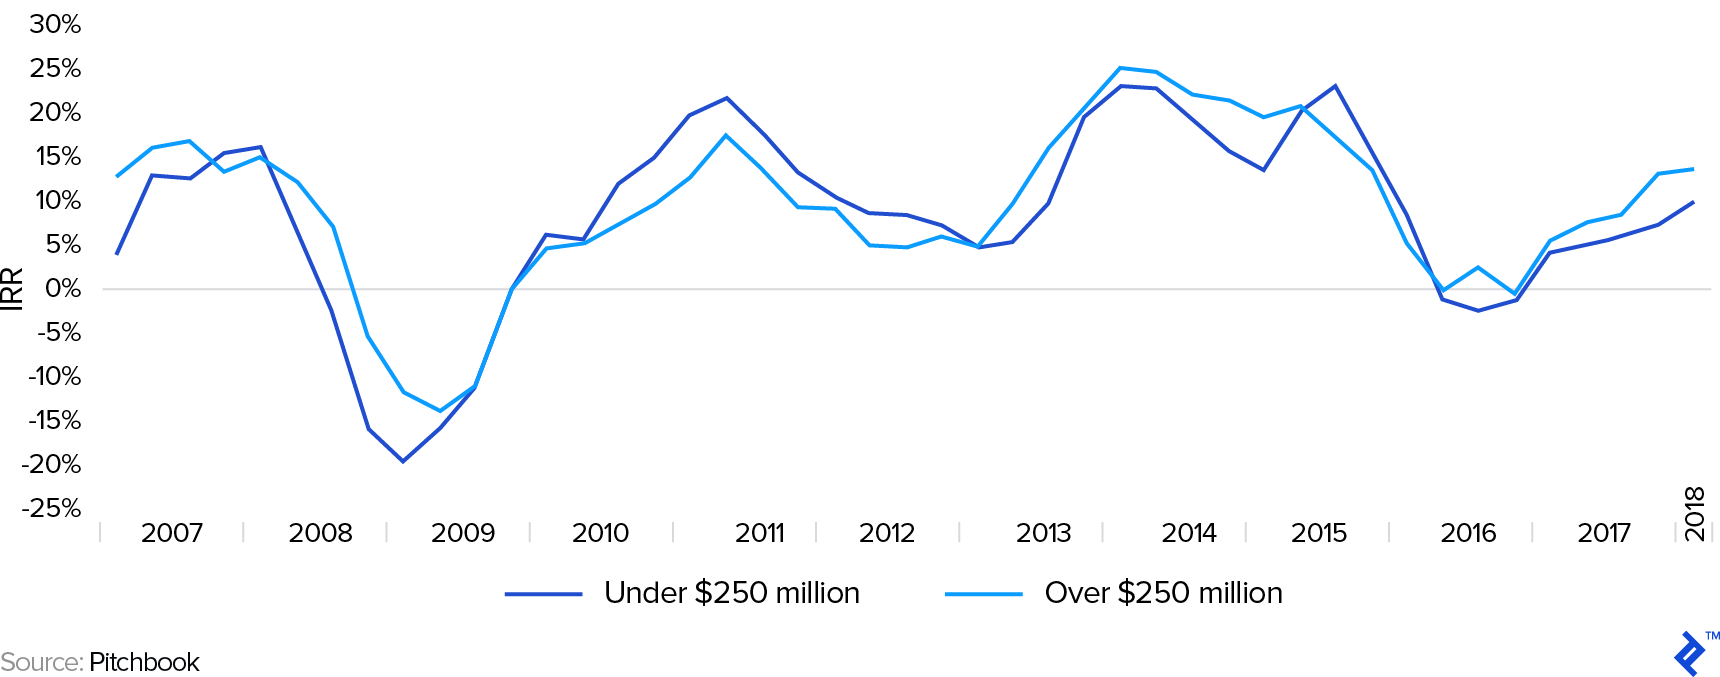
This will be explored later, but notice how funds of over $250 million AUM ride the waves and troughs higher than their smaller fund counterparts.
Looking at alternative asset performance on a macro level, over the past decade, none of them have outperformed the S&P 500 by a significant margin.
2008 – 2017 Global Alternative Asset Indexed Returns

Within the view of a longer investment horizon, this should not be put down to negligence on the part of alternative asset investors. Stock markets have had an unprecedented run during this time. What is particularly noticeable is that VC has largely stayed in line with its older sibling: private equity, an asset class that can be seen as less risky (beta of 2.2, versus VC’s 2.6) through its investment preference for fewer and older companies with less chance of outright failure.
Alternative assets have, however, increased significantly in popularity. In 2017 there were $8.8 trillion of assets under management globally, with the sector having grown by 12.1% annually since the financial crisis. VC funds have capitalized upon this, with the amount of capital raised per year growing by 100% over the decade to $78 billion in 2018 (excluding Softbank, which is technically a corporate VC unit).
2010 – 2018 Global Venture Capital Fund-Level Capital Raising Amount and Count

Mirroring the trends seen in startups, less VC funds are raising more capital. What is impressive within the context of this is how relatively small VC firms are from an employment perspective compared to the capital they deploy. Looking at a subset of data (Crunchbase) from firms that appear to be active, a picture of what a “median firm” looks like from an HR perspective emerges. The efficiency of them is stark: globally there are 3.8 firm employees in total per portfolio investment, dropping to a parsimonious 1.7 in Europe.
Median Venture Capital Firm Profile: Total Investments, Exits, Current Portfolio, and Number of Employees
| Global | USA | Europe | China | |
| Total # Firms | 2,973 | 1,816 | 562 | 33 |
| Median # Investments | 13 | 13 | 18 | 28 |
| Median # Exits | 4 | 4 | 4 | 4 |
| Median # Current Portfolio | 10 | 10 | 15 | 27 |
| Median # Employees | 38 | 37 | 25 | 98 |
Are VC funds themselves experiencing a similar “less is more” theme, as per what is being seen in the startup ecosystem? This section will look into the fund-level trends deeper.
1) Exits are Occurring
Since 2012, VC funds have been net distributors to their LP investors. Breaking an 11-year streak.
2000 – 2018 Global VC Cash Flows
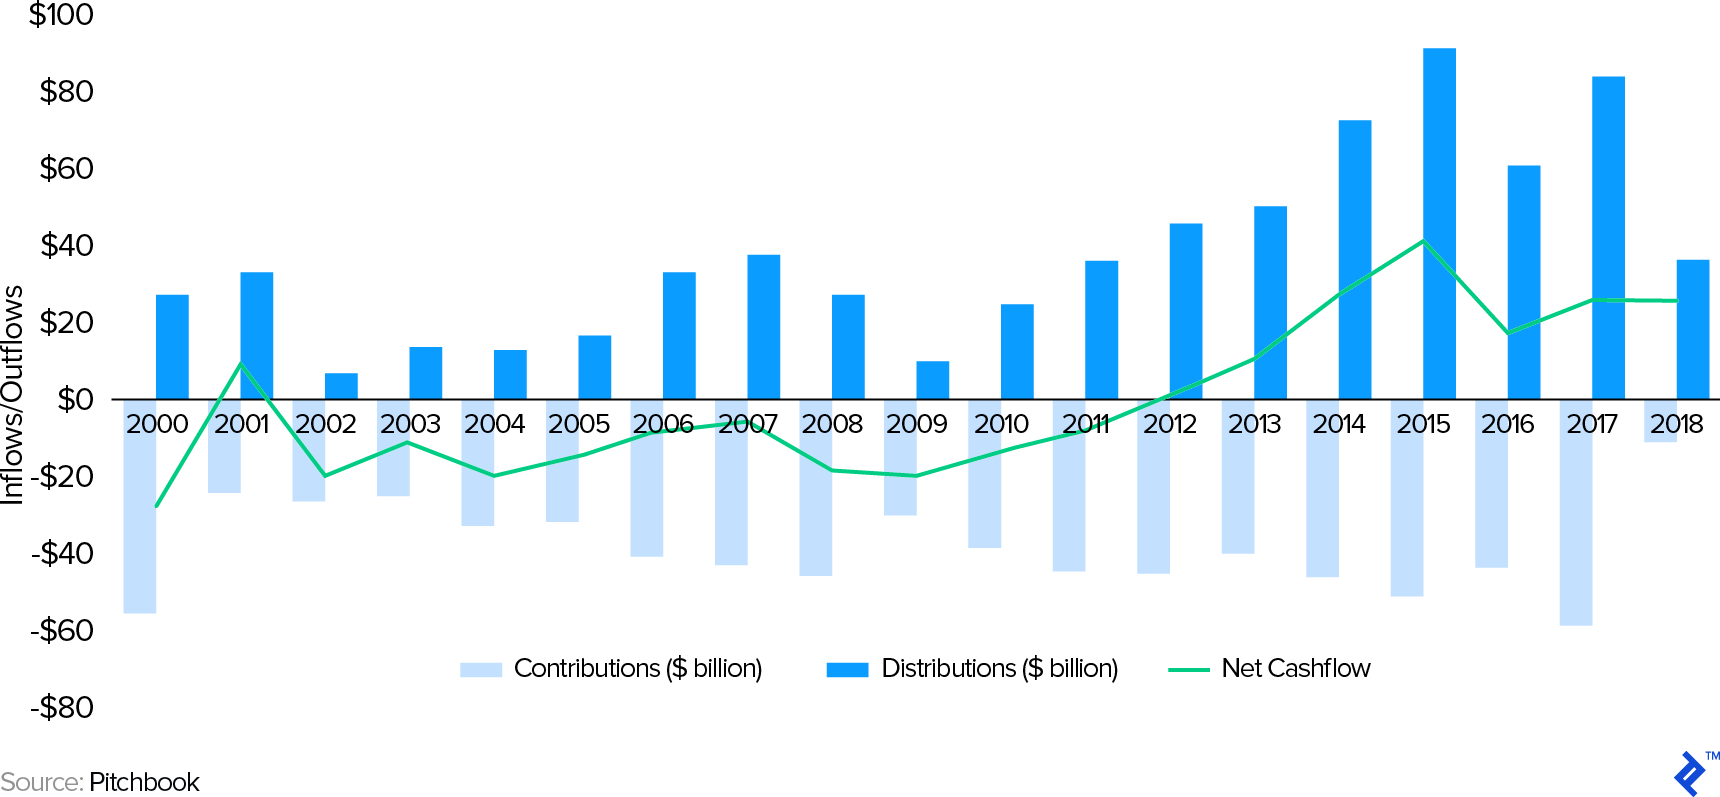
The bets of fund managers have come to fruition incrementally and investors have been rewarded for their patience. Over $300 billion was returned to VCs from exits in 2018 alone. The implications of this are that capital is now subsequently being recycled by appeased LPs, whose gains have attracted fresh investors to enter the VC market.
Exits follow a general upward trend, with a spotting of various years of outsized returns. To demonstrate, the chart below shows bumper years in 2012, 2014, and 2018 for the respective large exits of Facebook, Alibaba, and Spotify.
US Venture Capital-Backed Exits by Amount and Type

While the upward trend can immediately confirm the positive returns and liquidity environment, it’s the emergence of M&A as a lucrative exit option that is most pertinent. Traditionally an IPO was the sole route to a big exit, but now being acquired by an established corporate provides an alternative liquidity event. M&A is also possible throughout all stages of the lifecycle of a company. As an example, Jet.com was bought by Walmart for $3.3 billion only about two years after it was initially founded.
3) Capital is Being Recycled into Mega Funds
The escalation of fundraising to venture capital has largely been concentrated on large “mega” or “supergiant” funds with AUM pools of over $500 million. Over the past decade, the numeric composition of VC funds by AUM bucket has largely stayed static. On the other hand, the notional share of capital raised by funds has deviated significantly towards those with mega funds. In 2018, 66% of new capital raises were going into funds of over $500 million.
Distribution of US Venture Capital Fund Sizes: By Total Number of Funds (Left) and Total AUM (Right)

This behavior shows the widening inequality that exists in the venture capital industry. Larger funds can write bigger checks, do more follow-ons, and have their pick of the best startups due to their largesse and qualities. Patricia Nakache, a general partner at Trinity Ventures, noted that this is fracturing the balance of the startup ecosystem:
It’s really altering the structure of venture pretty fundamentally. I feel like over the past three years, the venture environment had bifurcated into this world of "haves" and “have nots” where there are some companies that have struggled to raise money and some companies that have been able to raise gobs of money.Patricia Nakache, general partner at Trinity Ventures
This trend is recent. Looking at the largest VC funds ever raised (Crunchbase), only two out of the top 15 of all time were raised before 2015.
Ranking of the Largest Venture Capital Funds Ever Raised
| Rank | Fund Name | Announced Date | Fund Owner | Money Raised $bn |
| 1 | SoftBank Vision Fund | Dec-2018 | SoftBank | $100.0 |
| 2 | Chinese Reform Holdings Corporation Fund I | Aug-2016 | Chinese Reform Holdings Corporation | $15.0 |
| 3 | Sequoia Capital Global Growth Fund III | Jun-2018 | Sequoia Capital | $6.0 |
| 4 | Tiger Global Private Investment Partners XI | Oct-2018 | Tiger Global Management | $3.8 |
| 5 | NEA 16 Fund | Jun-2017 | New Enterprise Associates | $3.3 |
| 6 | New Enterprise Associates 15 | Apr-2015 | New Enterprise Associates | $2.8 |
| 7 | New Enterprise Associates 14 | Jan-2012 | New Enterprise Associates | $2.6 |
| 8 | Tiger Global Private Investment Partners X | Dec-2015 | Tiger Global Management | $2.5 |
| 9 | Tiger Global Private Investment Partners IX | Nov-2014 | Tiger Global Management | $2.5 |
| 10 | AH LSV Fund I | May-2019 | Andreessen Horowitz | $2.0 |
| 11 | Impact Investment Fund | Oct-2017 | The Rise Fund | $2.0 |
| 12 | Sequoia Capital Global Growth Fund II | Jun-2017 | Sequoia Capital | $2.0 |
| 13 | BVP X | Aug-2018 | Bessemer Venture Partners | $1.9 |
| 14 | Lightspeed Venture Partners Select III | Jul-2018 | Lightspeed Venture Partners | $1.8 |
| 15 | Bessemer Venture Partners VIII | Apr-2011 | Bessemer Venture Partners | $1.6 |
If funds are investing in fewer seed rounds, then most of this money is being concentrated on large Series A rounds onwards. Mega funds are not doing anything materially different; simply finding the best deals and then doubling down on them for as long as possible and riding all of their growth, through “private IPO” rounds, up to eventually going public much later. Mark Suster summarizes the strategy:
The best are able to raise “growth funds" to complement their early-stage funds. These allow a combination of investing in pro rata in existing “best deals” while also jumping into other great deals one’s early-stage fund may have missed. That is why you’ve seen so many VC firms that only 20 years ago have $150 million funds raise $ billion growth vehicle.
The existence of more capital in VC rounds permits investors to “scale” their extraction of more value upside from the company pre-IPO. Traditionally, startups would IPO at sub-unicorn valuations because their growth cycle was at an earlier stage, now they ride the cycle later and the big investors keep more gains that would have traditionally been transferred to public market investors.
2) Unicorn Hoarding Shows That Esteemed Funds Can Reinforce Advantages
$1+ billion “unicorn” valued companies are necessary for VCs to earn outsized returns. A $1 million early-seed investment diluted over time could be worth 10% of a unicorn investment at exit time. That 100x return is what drives outsized venture capital portfolio returns.
The second tech boom, combined with the increased private lifespan of technology startups, has proliferated the status of unicorns. However, in turn, the distribution of unicorns by investors does not appear to be random in terms of its distribution.
Looking at the number of private unicorn investments (May 2019) shows that a disproportionate number of investors hold the majority of them. Equally so, there is a weak positive correlation between firms’ number of unicorns and their staff rankings on the Forbes Midas List. By applying a descending points system, with a maximum of 100 to the top-ranked investor, the aggregate scores of firms’ staff show the link between prestige and participation in successful startup investment rounds.
Number of Unicorns Held by Unicorn Investors and Their Correlation to Investor Midas List Placings
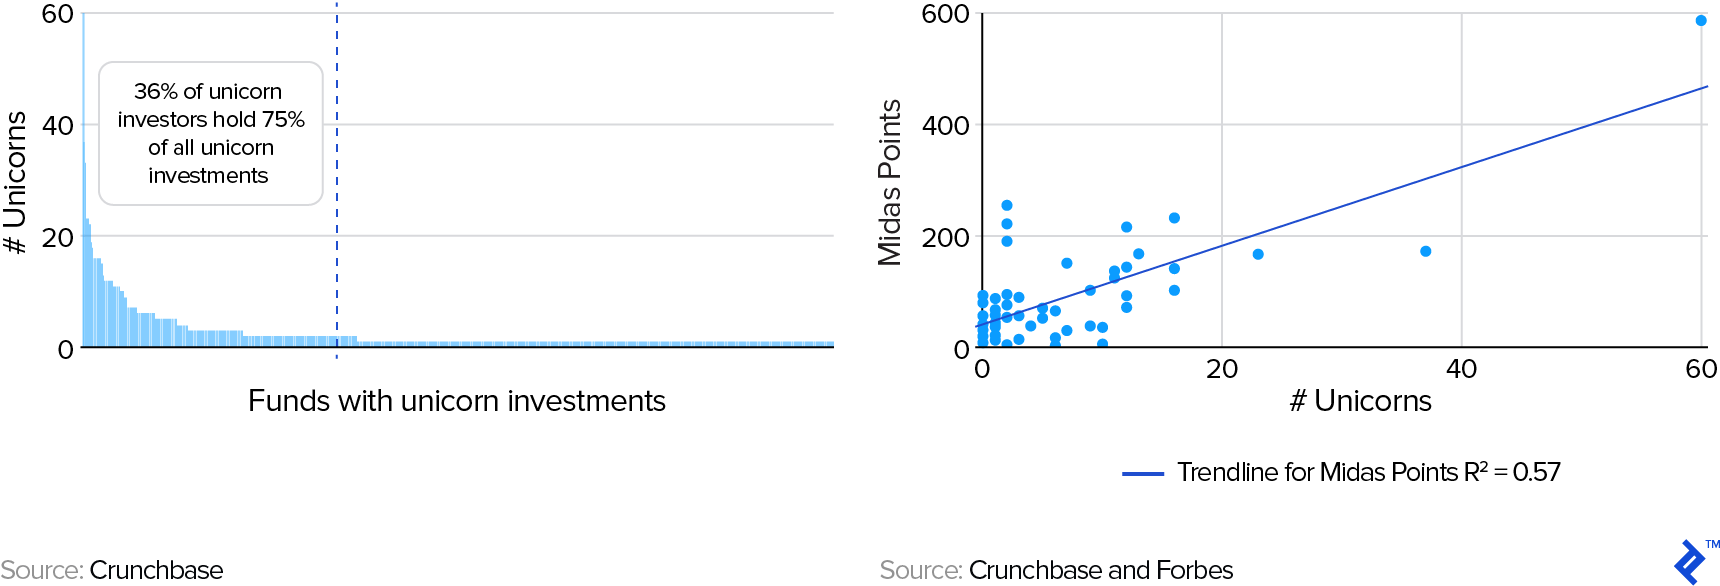
Unicorns have driven venture capital returns higher, but their distribution suggests that the best investors have an informational/reputation advantage which allows them to get more access than the everyday VC.
For smaller seed funds this concentration of unicorns is, in some ways, a good thing. They only really need one big unicorn to make their portfolio return lucrative and if it’s a trend that successful companies are funneled through a streamlined venture capital process by the established unicorn hoarders, then it gives them more clarity over what they need to do to succeed.
A secondary level effect of the unicorn era is that successful funds go on to be even more successful. This Preqin fund cohort analysis shows the pattern that good funds are not a one-off and will use past success as a platform to build.
Relationship Between Predecessor and Successor Venture Capital Fund Quartiles (2017)
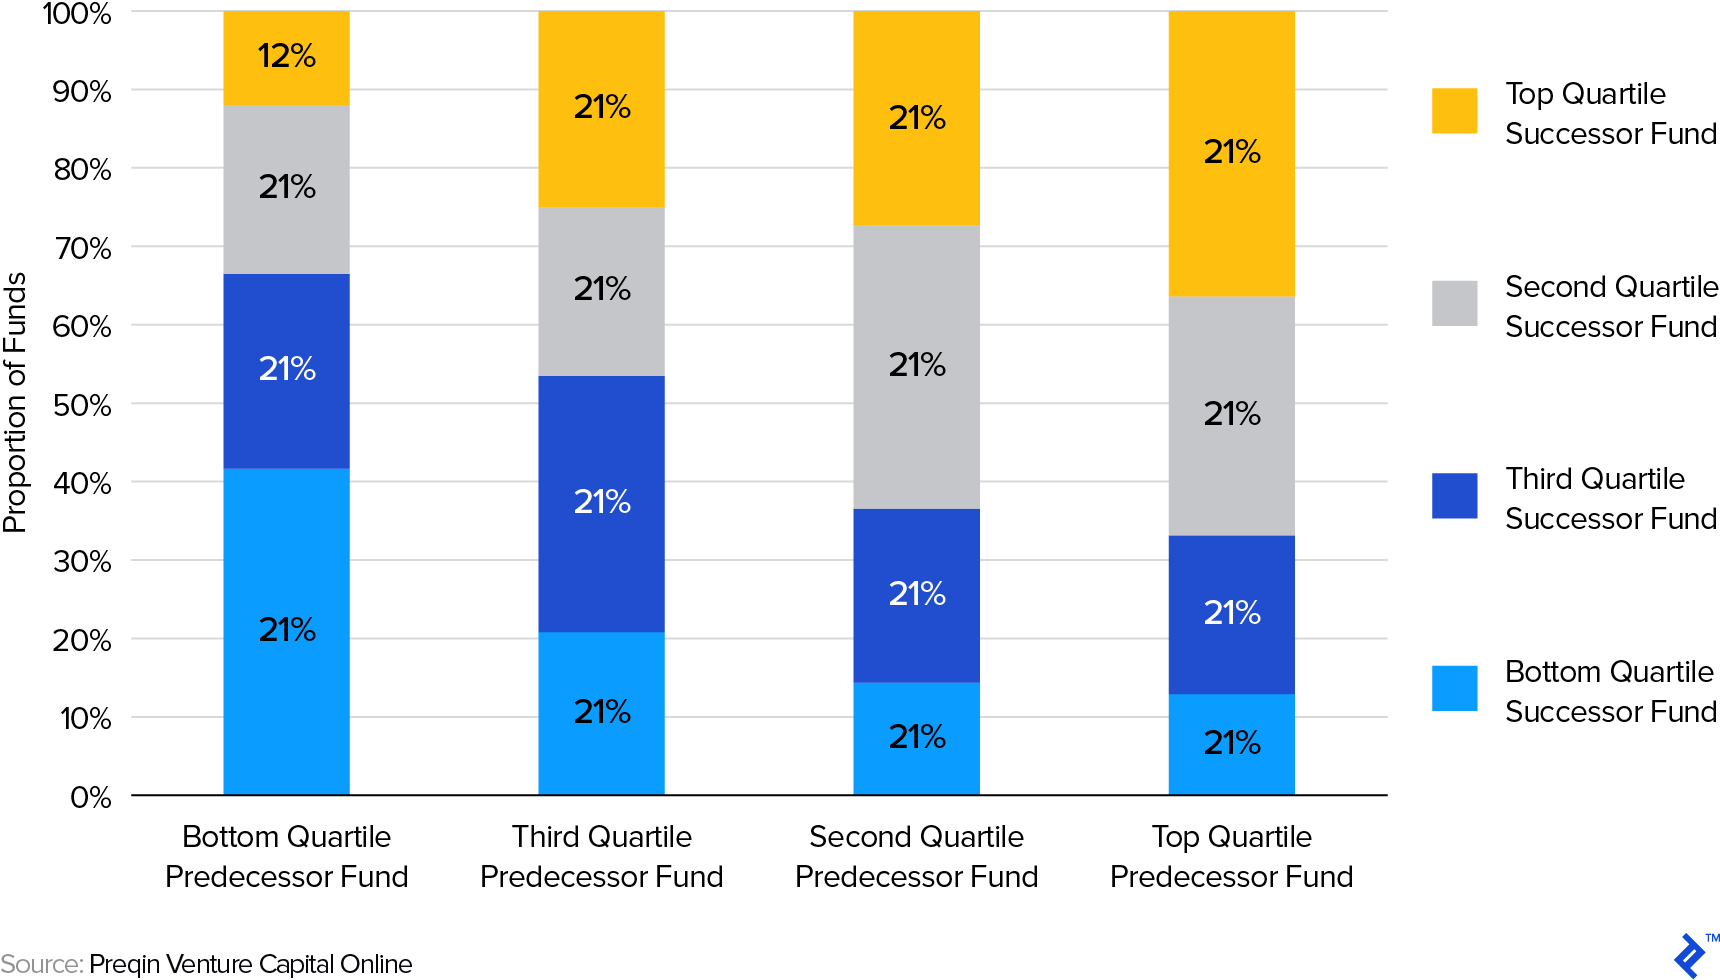
Part of this analysis might be blurred by survivorship and there is no tacit implication that a successful fund “must” have unicorn investments. Yet, unicorn investing is a philosophy that promises returns and increased future success through the enhanced funding and reputation that will arrive thereafter.
Opportunities for the Venture Capital Industry Going Forward
After having discovered what has happened and why, the perspective can now shift to looking forward and highlighting the positive signals being shown by the venture capital industry, and how participants can seize upon them.
1) New Geographic Frontiers
Traditionally, VCs invest in their home market; 50% of US deals are made in the investors’ home state. Face-to-face conviction is, therefore, a significant part of investing. This has changed in recent times, Sequoia Capital is one example of a fund that is now truly global and on the ground in core markets like India and China.
Brick and mortar proximity is not a prerequisite for global dealmaking: Despite having a $100 billion fund headquartered in Japan and with a pace of 44 deals a year, Masayoshi Son—the CEO of Softbank—meets personally with the founders of every team he invests in.
In terms of the global distribution of startup success, the number of private unicorns has grown from an initial list of 82 in 2015, to 356 in Q2 2019. In this time, the geographic composition has also widened, despite the USA and China still being home to over 75% of them.
Q2 2019 Geographic Distribution of Unicorns

In these four years, there has been a growth of both numbers and distribution, from 9 countries to now 26. Global investors are investing more in frontier markets, and those that spot winners early will be able to capitalize on this trend.
Highlights from prominent regions are explained below. These are merely top-down snapshots that serve to demonstrate that in the face of heightening competition for local deals, VCs can look abroad for more ambitious bets. Funds increasingly have scouts working remotely in these regions, rewarding the brave with earlier round entrances.
AFRICA
The state of venture capital in Africa is promising. In 2018 the number of VC deals doubled to 458, with $725.6 million invested across the continent. The top ten deals accounted for 61% of VC funding raised, which follows wider venture capital industry trends of the most encouraging startups being given capital to execute winner-take-all strategies.
25 Africa-focused VC funds launched in 2018—with $1 billion of capital ready to deploy—doublingthe investor base in the space of a year. Kenya, Nigeria, and South Africa are the most burgeoning markets for venture capital opportunities.
LATIN AMERICA
As of 2019, 18 unicorns have been minted across the region, with fintech, marketplaces, and logistics being of particular importance sectorally.
There is already a wide ecosystem of local investors, but larger foreign ones (predominantly from the USA and Spain) are increasingly entering to help Series A rounds onwards. Softbank’s LATAM focused $5 billion Innovation Fund further demonstrates the viability of the region for those seeking new frontiers.
SOUTH EAST ASIA
$4.75 billion was expected to be invested across this region of 640 million people in 2018. Grab and Go-Jek have demonstrated innovation excellence by combining mobility with wider eCommerce and fintech propositions.
There are a number of elements that make emerging economies like Vietnam, Indonesia, and the Philippines intriguing from an investment perspective.
2) Micro Funds in Neglected Areas
Micro funds are a purists’ view on what venture capital should be. Small AUMs and purely angel, seed and the occasional Series A round investment in hyperlocal locations with high-touch interaction. The size of what a micro fund should be is accepted to be less than $50 million, but this is something that should be relative to the specific geography’s stage of development.
Despite the focus on mega rounds and funds, micro investing remains an important stakeholder for cultivating the next successful batch of startups. On an overall basis this excellent analysis shows that their returns on an aggregate level are not staggering, but they tend to thrive in focused areas:
Many micro-VCs in the US have generated a lot of buzz and have good brands but often the good performances are driven by unrealized marks, stale prices, and market exuberance. In Europe, the story is different. Seed stage investing is less competitive and the demand is bigger than supply.
For Europe—a sandbox of investment arbitrage opportunities on the geographic, economic, and human resources levels—to have a disproportionate number of micro VCs operating seems like a glaring opportunity that’s gone missing.
Proportion of Micro Venture Capital Funds in Market by Geographic Focus (2016)
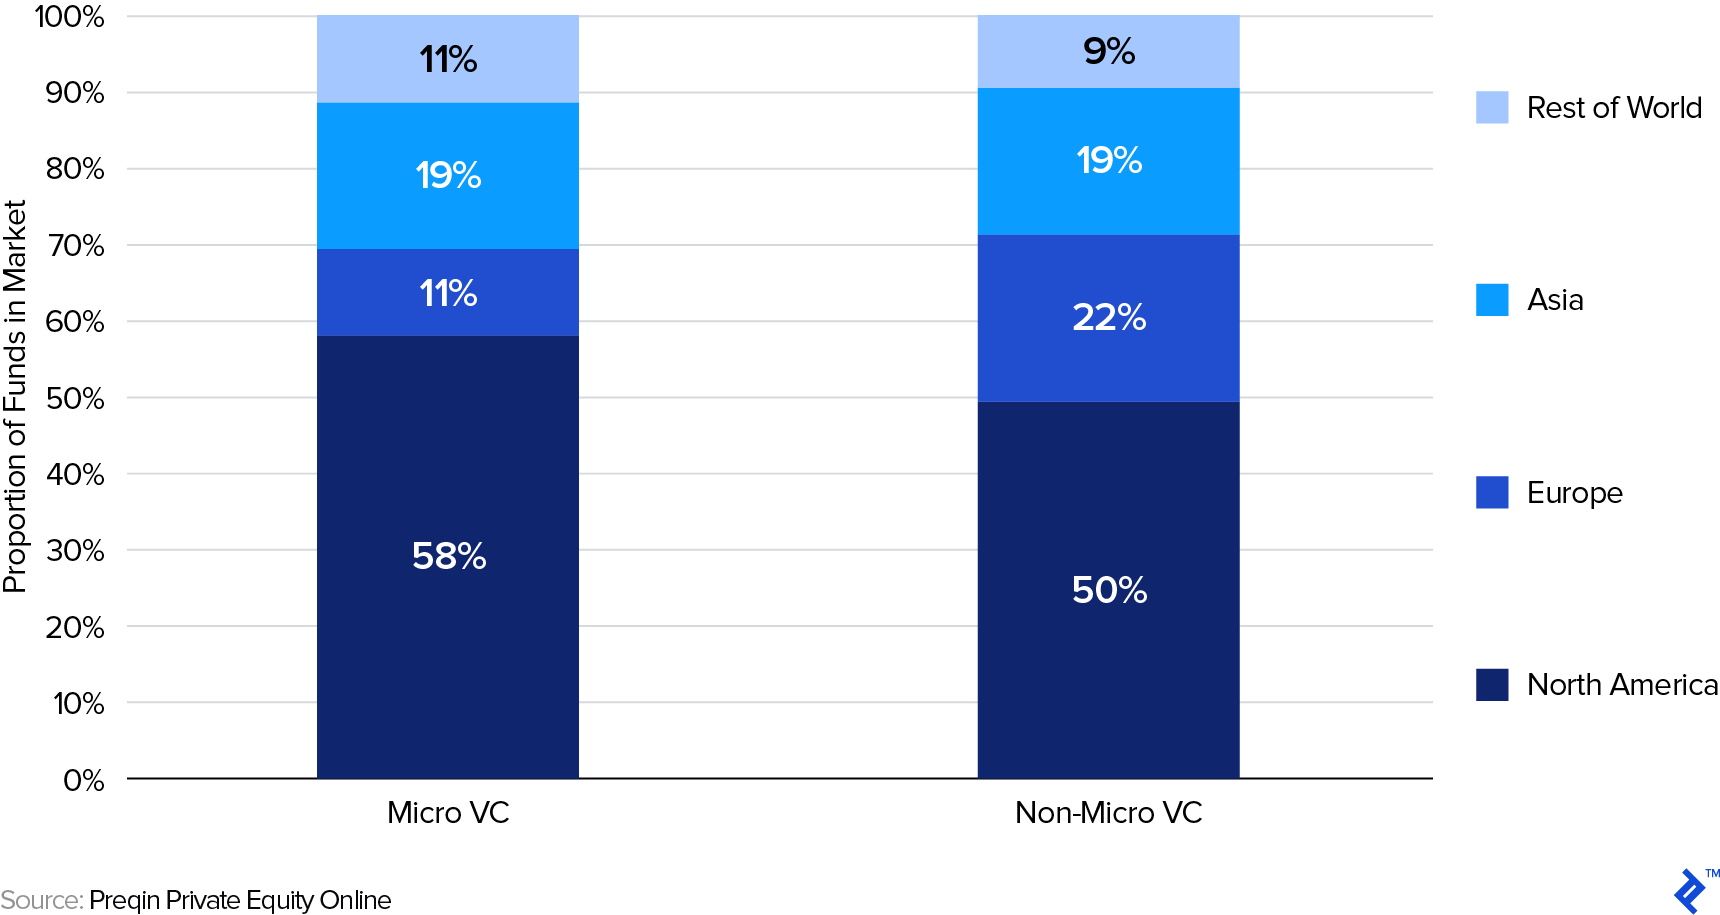
Opportunity exists here to capitalize upon the uptick in round valuations that has occurred over the past decade in neglected areas.
2010 – 2018 Global Pre-Money Startup Valuation by Series ($ Million)

Median seed valuations have increased by a CAGR of 11.2%, compared to 16.2% and 15.0% for Series A and Series B, respectively. This accelerated round uptick can be attributed to the seed market largely staying the same structurally, while later rounds have faced the inflation brought on by increased capital influx. This may appease micro investors, as the valuation uptick is working in their favor.
Where Micro VCs tend to struggle from a returns perspective is through maintaining enough ownership for their winners to have a material impact on fund returns. The larger and dilutive later round valuations make it difficult for micro VCs to exercise pro-rata rights.
Being a “maintainer” (keeping enough for follow-ons) is one of the core strategies of micro VCs. This can end up being a scotch tape affair of raising opportunity fund SPVs to raise follow-on financing outside of their original fund. If that’s now more difficult then focus should turn to the two alternatives, which present viable seed investing models:
- Accumulators: Conviction-lead investing in more targeted startups to ensure 20% is held at exit.
- Parallel Founder Dilution: Alignment with founding team by investing to own a stake that dilutes in line with teams’ own.
The neglection of seed also presents sectoral opportunities for brave investors to find quality deals in industries that are away from the core focus of larger funds. VC William Hurley highlighted the risks faced by these tertiary markets, which in itself presents an opportunity for micro funds investing in seed:
The decrease in deal count amid an increase in deal value means it’s difficult for companies that work in more complex, academic sciences, such as drug development or quantum computing, to raise money.VC William Hurley
Threats Facing the Industry
As much as there is opportunity in the venture capital industry, there are also lingering issues that need to either be addressed outright or plotted a course around.
1) Venture Capital Valuation Multiples are High and IPO Stakeholders Seem Misaligned
Valuations rising is only good for VCs if they can ride the wave long enough to exit in time. If they have to pay more for deals at higher valuations, then they are increasing risk, lowering governance influence and relying on growth and margin expansion rising. Growth in valuations has overtaken the pace of revenue growth, and consequently, there has been a widening of enterprise value to revenue multiple ratios.
Looking at the industry of SaaS, since 2011, EV/revenue (ARR) has increased by 130% for private companies. Yet in the public markets, the expansion has been limited to 36%.
SaaS Revenue Valuation Multiples for Public and Private Markets
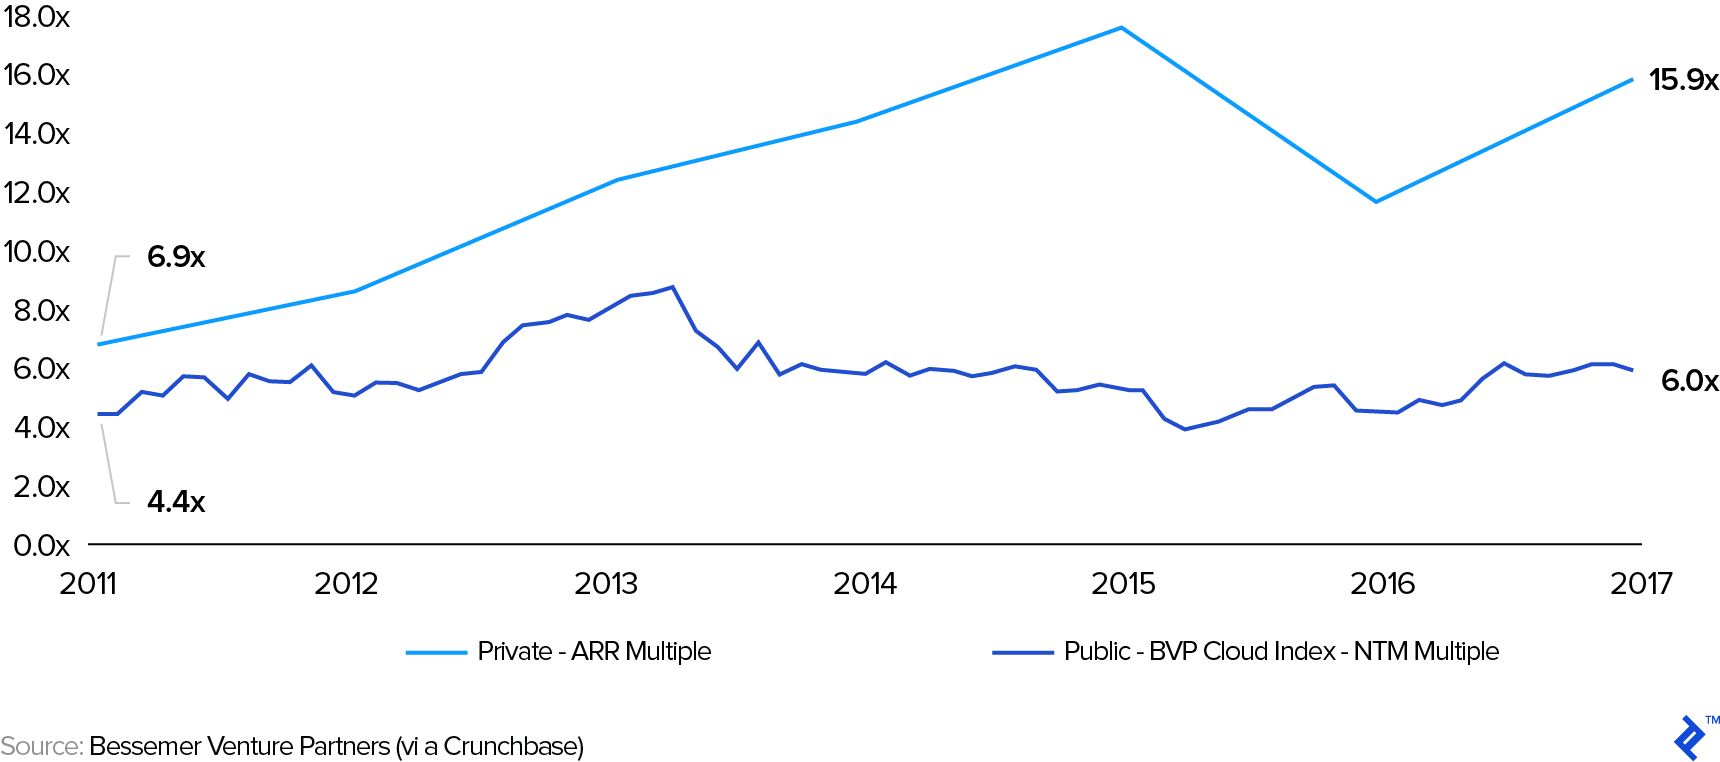
The common rationale for this is that private companies have more growth opportunities; the investor is paying a premium for growth upside potential. But for public markets to accept an IPO and upwardly propel its price thereafter, there will need to be signs of considerable revenue growth between final private rounds and early life as a public company.
LIQUIDITY RISKS
As has been observed in 2019, some disappointing IPO entrances from Uber and Lyft highlighted that public markets are a different beast to private rounds. Traditionally, IPO investors were distinct to private ones, yet in recent years, mutual funds and the like have been allocating capital between the two indiscriminately. This has resulted in less clamor for IPO allocations from such large investor entities.
The need to IPO nowadays is not to find new capital sources, but instead to provide liquidity to earlier investors for crystalizing their gains. Yet in recent years, companies going public have still not yet settled on stable business models; consequently, the percentage of companies going public with negative earnings has now reached peak dot-com bubble territory.
Share of US IPOs with Negative Earnings: 1990 – 2019

The sheer volume of private capital available has blurred the focus on private startups to find sustainability quicker. When they do eventually debut, it can seem like they are limping over the line, instead of galloping onwards. If there is still clear growth upside, then it can be an acceptable trade-off to consider, but if it is tapering off, public investors will reject the stock.
This trend is a threat for VCs going forward because alienating or taking liberties with the public markets may ultimately lead to their doors closing. By alienation, this refers to not leaving enough growth on the table to provide a compelling investment for the price, but also in terms of how the startup markets itself. Ben Thompson was particularly scathing of Uber’s investment prospectus, which he described as:
This S-1 is so devoid of meaningful information (despite its length) that it makes me wonder what, if anything, Uber is trying to hide.
It also goes without saying that corporate investors, or those who are not investing money ring-fenced in closed-ended fund structures, could cause contagion risk to the VC market if there is a cash crunch in the wider economy. This could force such entities to try and fire sell assets and/or abruptly curtail investment cadence.
2) Regulation and the Economy
Regulation is a stereotypical topic that would appear under such a section of threats. Within the context of the venture capital industry, there are a number of areas that it must exercise vigilance on, due to potential ramifications on operations and/or investments.
CARRIED INTEREST LOOPHOLE CLOSING
Many may read this and think “who cares,” but the threat of closure of the three-year loophole in the US that allows for alternative asset managers to class carried interest as capital gains over income is a hanging one. Most good-natured managers will just see it as the price to pay within the context of great returns, but others may look for a way around it. Such as:
- Trying to flip investments within permitted window times, placing perverse pressure on invested companies and other investors.
- Disparate systems of management fees and carried interest emerging, where the best managers pass over increased tax load to their investors via higher carry charges.
THE ECONOMY AND TRADE WARS
Private early-stage equity investing can actually be a good hedge against economic downturns. During such periods, certain costs become cheaper and talent more readily available. The timing also allows for younger startups to plan their go-to-market more thoroughly during the aftermath lull.
Yet, an escalation of geopolitical events could have severe knock-on effects globally for venture capital investors and their investments. Current topics of interest here are:
- Cross-border tariffs
- Technological security measures
- Break-ups of large corporations to stem antitrust concerns
Existential regulatory threats to the life of a startup are prevalent factors for certain industries like biotech and fintech, but those in the consumer space tend to find means of navigating around them unscathed (think: Uber). If cross-border access to materials or markets gets limited, or break-up/localization restrictions get enacted—or stay looming—it could create greater uncertainty for the prospects of investments and their ability to go global.
The Venture Capital Industry is a Virtuous Circle of Bigger Funds and Bigger Rounds
So, to distill this report into six brief lines, this is what has happened recently in the VC market:
- There are less startup fundraises going on, but more absolute funding is going into older companies.
- Startups are being identified, anointed and funded with significant largesse early to ensure they seize the market.
- An increase of “tourist investors” has contributed further to round size inflation post-seed stage.
- Big exits are validating the VC asset class and leading to capital being recycled.
- Exits are taking longer though, as they ride to the peak of growth in private markets.
- Yet, as with startups, capital is increasingly being re-allocated into a concentration of larger funds with proven managers.
This report has touched on events that some purist VCs may seem as too “financey” and against the black magic of picking winners. Yet such ostriches might be forgetting that wide-ranging factors far behind VCs’ control, like quantitative easing, finite natural resources reserves and emerging market middle-class growth have combined in some way to lead the bull run they are on.
Creating a Platform for Success
As is known, venture capital investing can be more art than science. There is no way to gamify this. For that, the best way for a VC to thrive is to create the right platform for success.
A 2015 Stanford study found that 43% of US public companies were VC-backed. This totals 38% of public sector employees and 82% of total R&D spend. As a measure of this amplified impact, during the prior 50 years, VCs raised 4x less money than Private Equity firms and only invested in 0.19% of new businesses.
The point being made here is that the venture capital industry has risen significantly in terms of its strategic importance for economies. Governments now regularly act as pillar investors for funds, because venture capital invests in job creation that some public policies can only dream about. In a way, VCs are fortunate enough to already the platform to succeed through the positive narrative that has built up around them.
Investors should acknowledge that a headwind of macro forces has largely worked in their favor, but may one-day change direction rapidly. Instead of getting hung up on this, they should instead look inward and practice what they preach to their own startups: focus on fundamentals, exercise conviction and seize first-mover advantages. For that, having a solid investment hypothesis, sufficient capital to make bets that can be followed on with and the right team around them to execute, is the key for a VC navigating the seas of this ever-changing asset class.


