TAM Methodology: An Explanation and Example of Total Addressable Market Analysis
Often miscalculated and misused, TAM, SAM and SOM are critical for managers and investors to understand revenue potential, market positioning and competition.


This article was originally published on Toptal in August 2017
TAM Is a Popular Metric That Is Often Misunderstood
Total addressable market (TAM, occasionally referred to as total available market) is a form of market sizing that enables a business to define the holistic revenue opportunity offered from its product or service. It is an exercise that will shed light towards the level of effort and funding to be put into a new business line, because it provides guidelines about the largesse of its economic potential.
In modern times, a TAM has become an important metric and a more creative process of calculating it has emerged due to the increased speed in which new markets are evolving. The realization of Moore’s Law is shortening technological improvement cycles and adding (exciting) uncertainty about the rapid coalescence of markets. For that, a deep understanding about TAM allows entrepreneurs to be aware of the blurred lines between their markets.
The Advantages of a Thorough TAM Understanding
The importance of a TAM exercise is primarily to understand the revenue opportunity, but it also offers secondary advantages:
- Focuses owners on their future roadmap and product evolution.
- Provides a current waypoint for assessing product market fit.
- Attracts and appeases investors by showing accuracy and conviction.
- Puts competitors within a line of sight early on.
In 2014, a debate occurred between NYU professor Aswath Damodaran and investor Bill Gurley over a valuation that the former attached to the latter’s investment in Uber. The low valuation that Gurley was questioning resulted from Damodaran calculating a TAM that assumed that Uber was just a taxi/limo service. Gurley’s retort was that Uber was addressing a far bigger field; it was a transportation business:
In choosing to use the historical size of the taxi and limousine market, Damodaran is making an implicit assumption that the future will look quite like the past
The Uber example shows the ambition that many modern companies have when looking to tackle a market. Initially within the context of people logistics, Uber’s MVP and initial offering was within cabs, indeed a small subset of the services transportation market. The subsequent introduction of X, POOL, EATS, and RUSH services has shown its desires to tackle a wider reach of the market, which has validated Gurley’s thesis. Uber’s research and development into self driving cars and long distance hauling shows that it does not intend to stop expanding. Conversely, there are no mooted plans for Uber to get into air travel/freight, so it’s not trying to tackle its entire TAM.
The TAM will show the theoretical total market that could exist for a product assuming unencumbered access to it and unlimited operational resources from the provider. Only within a monopolistic industry, where one player has the resources and scale to serve the entire potential market would this be possible. Broadly speaking, just government services and public utilities receive this bonus.
If it is almost impossible to capture 100% of a TAM, then why is it included in almost every pitch deck? Well, a TAM will spit out a large number, which attracts eyeballs and stimulates conversation. But the devil in this detail will be in the second and third layer analysis of the TAM; the serviceable available market (SAM) and the serviceable obtainable market (SOM). The last measure is most important; it shows what is realistically being targeted to be captured by the business. It’s all about finding the tip of the iceberg:
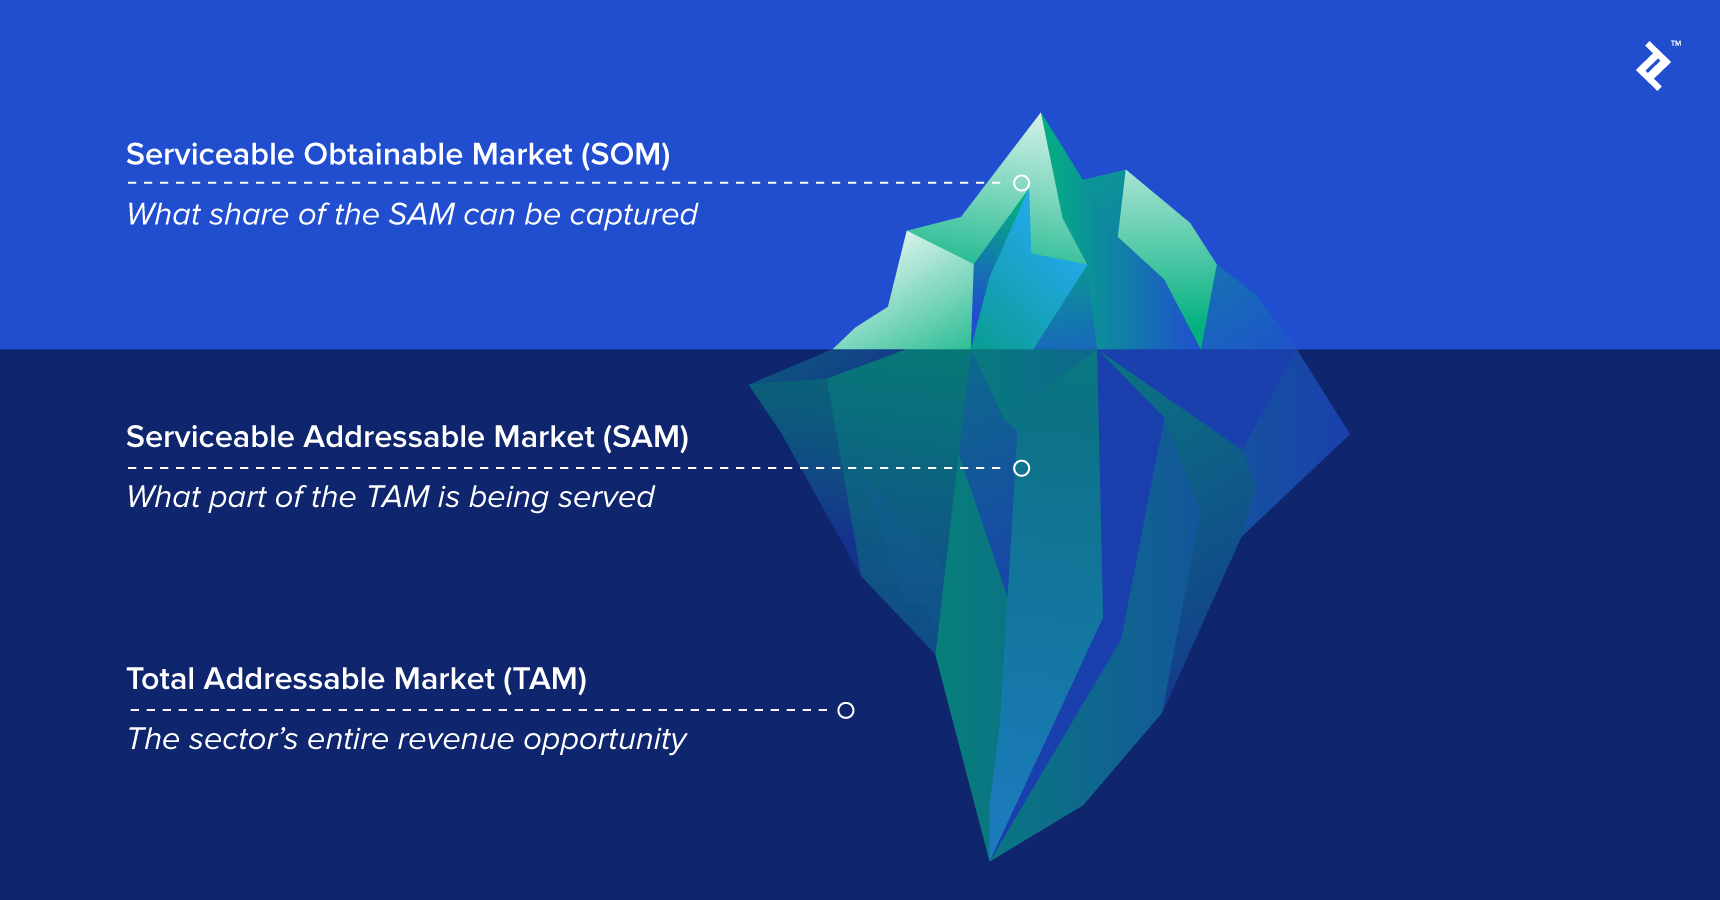
Pitch decks can have the tendency to ignore SAM and SOM and just try to hazard a guess for a TAM, leaving it at that. Through this omission, they often make sweeping and ill-defined generalizations about a customer base, such as “we are targeting millennial smartphone users.” Down the line, a failure to have a true guide of a TAM, SAM, and SOM, with considerations towards customer segmentation and competitive dynamics, can lead to disappointing outcomes and poor product-market fit.
Working Example
To give some application to the article, I will work through a real example of a TAM, SAM, and SOM for WeWork. Not only is it a highly valuable and well-known company, but it is also one that is transcending the traditional perceptions of its market.
Note: I am excluding the division WeLive (residential living), due to the complexities of clearly explaining two methodologies on a concurrent basis for different offerings.
How to Calculate Total Addressable Market
On a high level, we first ask, “What is TAM”? The straightforward answer to this is that TAM is an expression for the annual expected sales within an observed market.
average revenue * number of customers for the entire segment of the targeted market
There are three primary collection methods and one secondary method for calculating TAM:
- Top-down takes a macro view of assessing factors right at the very top of an economy.
- Bottom-up looks at a subset of a localized situation and then extrapolates the results to the wider market opportunity.
- Value theory focuses on the positive externalities derived from an offering versus incumbent options.
- The secondary collection method uses verified third-party research (also known as external research), which I shall explain first.
1. External Research
An easy and quick way of finding a TAM is to reference professional data that has already been collected. Private research reports are expensive, but sometimes their headline figures are released into the public domain via press releases. The advantages of using these figures lean towards the pragmatic side; they are quick to obtain and within the laws of the division of labor, they are compiled by a more skilled professional with credibility.
Companies such as Gartner, Forrester, and IDC research and publish industry reports with deep dives on sectors, usually containing statistics such as the revenue opportunity and future potential. A brief search yielded a press release from Gartner stating that the cybersecurity market was worth $81.6 billion in 2016.
The disadvantage of this method is that it is a black box in terms of how the number was calculated. If an investor asks you to defend the rationale behind the figures, the only defense will be, “Well, it was published by X, so it’s valid.” Making your own TAM will provide you with deeper understanding and more leverage to debate the numbers.
2. Top Down Approach
The top down approach takes the ethos that you start at the very top of a macro data set and chip away at the data to find a market subset. You start with a population and then logically apply demographic, geographic and economic assumptions to eliminate irrelevant segments.
The advantage of this method is that accurate and open statistics can be found for macroeconomic data. To name some sources: UN, OECD, The World Bank and CIA World Factbook.
For example, if the recommended intake of water is 1.9 liters per day and there are 7.5 billion people in the world. Using an average cost of $1.22 per gallon ($0.32 per liter) and a desired margin of 20%, the TAM for bottled water could theoretically be:
7.5 billion people * 1.9 liters * $0.32 price per liter * 120% margin * 365 days = $2.01 trillion TAM
3. Bottom Up Approach
This method involves working on a granular level to find waypoints that are extrapolated up to the wider population. It is favored for being more accurate, because its basis is anchored around a proven data point, which can be magnified to uncover the whole TAM population. One can use primary collection methods (such as a survey in a local market), or secondary research (news reports, company filings).
For example. Tesco has 27.8% share of the UK grocery market. Tesco’s most recent results show that, for the year ending April 2017, it had revenue of £35.9 billion (excluding gas and Republic of Ireland sales). Putting these two together extrapolates that in 2017 the UK grocery market has a TAM of £129.1 billion per year ($167.1 billion).
A disadvantage of the bottom-up method is that due to the vast assumptions being made from a figuratively small subset, the TAM can be way off. This is particularly applicable for a global TAM calculation, where factors such as population density, economic prosperity, and consumer preferences vary drastically across nations.
4. Value Theory Approach
Top down and bottom up methods usually look at existing paradigms and assume that a new offering will fit into them. Yet, how could one assess the opportunity for, say, flying cars, when flying cars don’t yet exist? For products or services that can evolve a market into a new state and/or provide value-add to different groups of consumers, the value theory may be the best option.
With value theory, one must assess how much a customer would be willing to pay for an improvement/evolution of a product. Such an exercise would have been useful when music streaming subscription services, like Spotify, started to roll out. At that time, consumers would pay a fixed price to buy music, yet the value-add of not owning a song but having access to a large library of them to effectively “borrow” was such that the common pricing we see now of $9.99 per month was deemed value-additive. Attaching that pricing to the number of music listeners would have shown the TAM more appropriately than simply looking at how much was spent at the time on purchased downloads.
What WeWork’s TAM Would Be
To start, I will define what WeWork is in the broadest sense, within the SAM and SOM sections I will go deeper into its true positioning and service offering. For that, WeWork is in the market of providing work space to service sector workers, on a subscription basis: space as a service (SpaaS), perhaps?
Between the three methodologies, I chose to use a top down method, starting with employment for a select group of countries. The bottom up methodology would be far too sensitive to apply to different geographies. The value theory method could be appropriate for such a transcendent company, but the subjective nature of it could turn what is intended to be a tutorial into an anthropological study into the monetary value of networking.
I will now explain the top down rationale that I will use, step by step:
- I defined my geographic universe as the 35 members of the OECD and five other countries where WeWork currently has operations (Argentina, Brazil, China, Colombia and India).
- Using a combination of OECD and UN data, I worked out the percentage of the labor force working in services. This was then trimmed to desk jobs using US BLS data for the ratio of relevant subset desk jobs to the entire service sector.
- Using more OECD data, I stratified the workforce by the size of the company that the employees work for, assuming that smaller companies/entrepreneurs would use shared desks at WeWork, but companies of over 10 employees would want more expensive private offices.
- Using quoted prices from a random WeWork office in each US city that it operates in (this was 22 cities at the time), I came up with a composite price for a hot/dedicated desk and private office seat of $378 and $610 respectively. I assumed that this is a fair reflection of the average market price for shared workspace, as WeWork is the market leader in the USA.
- I used OECD PPP indices to adjust the USD price of this service to a fair price for the other nations.
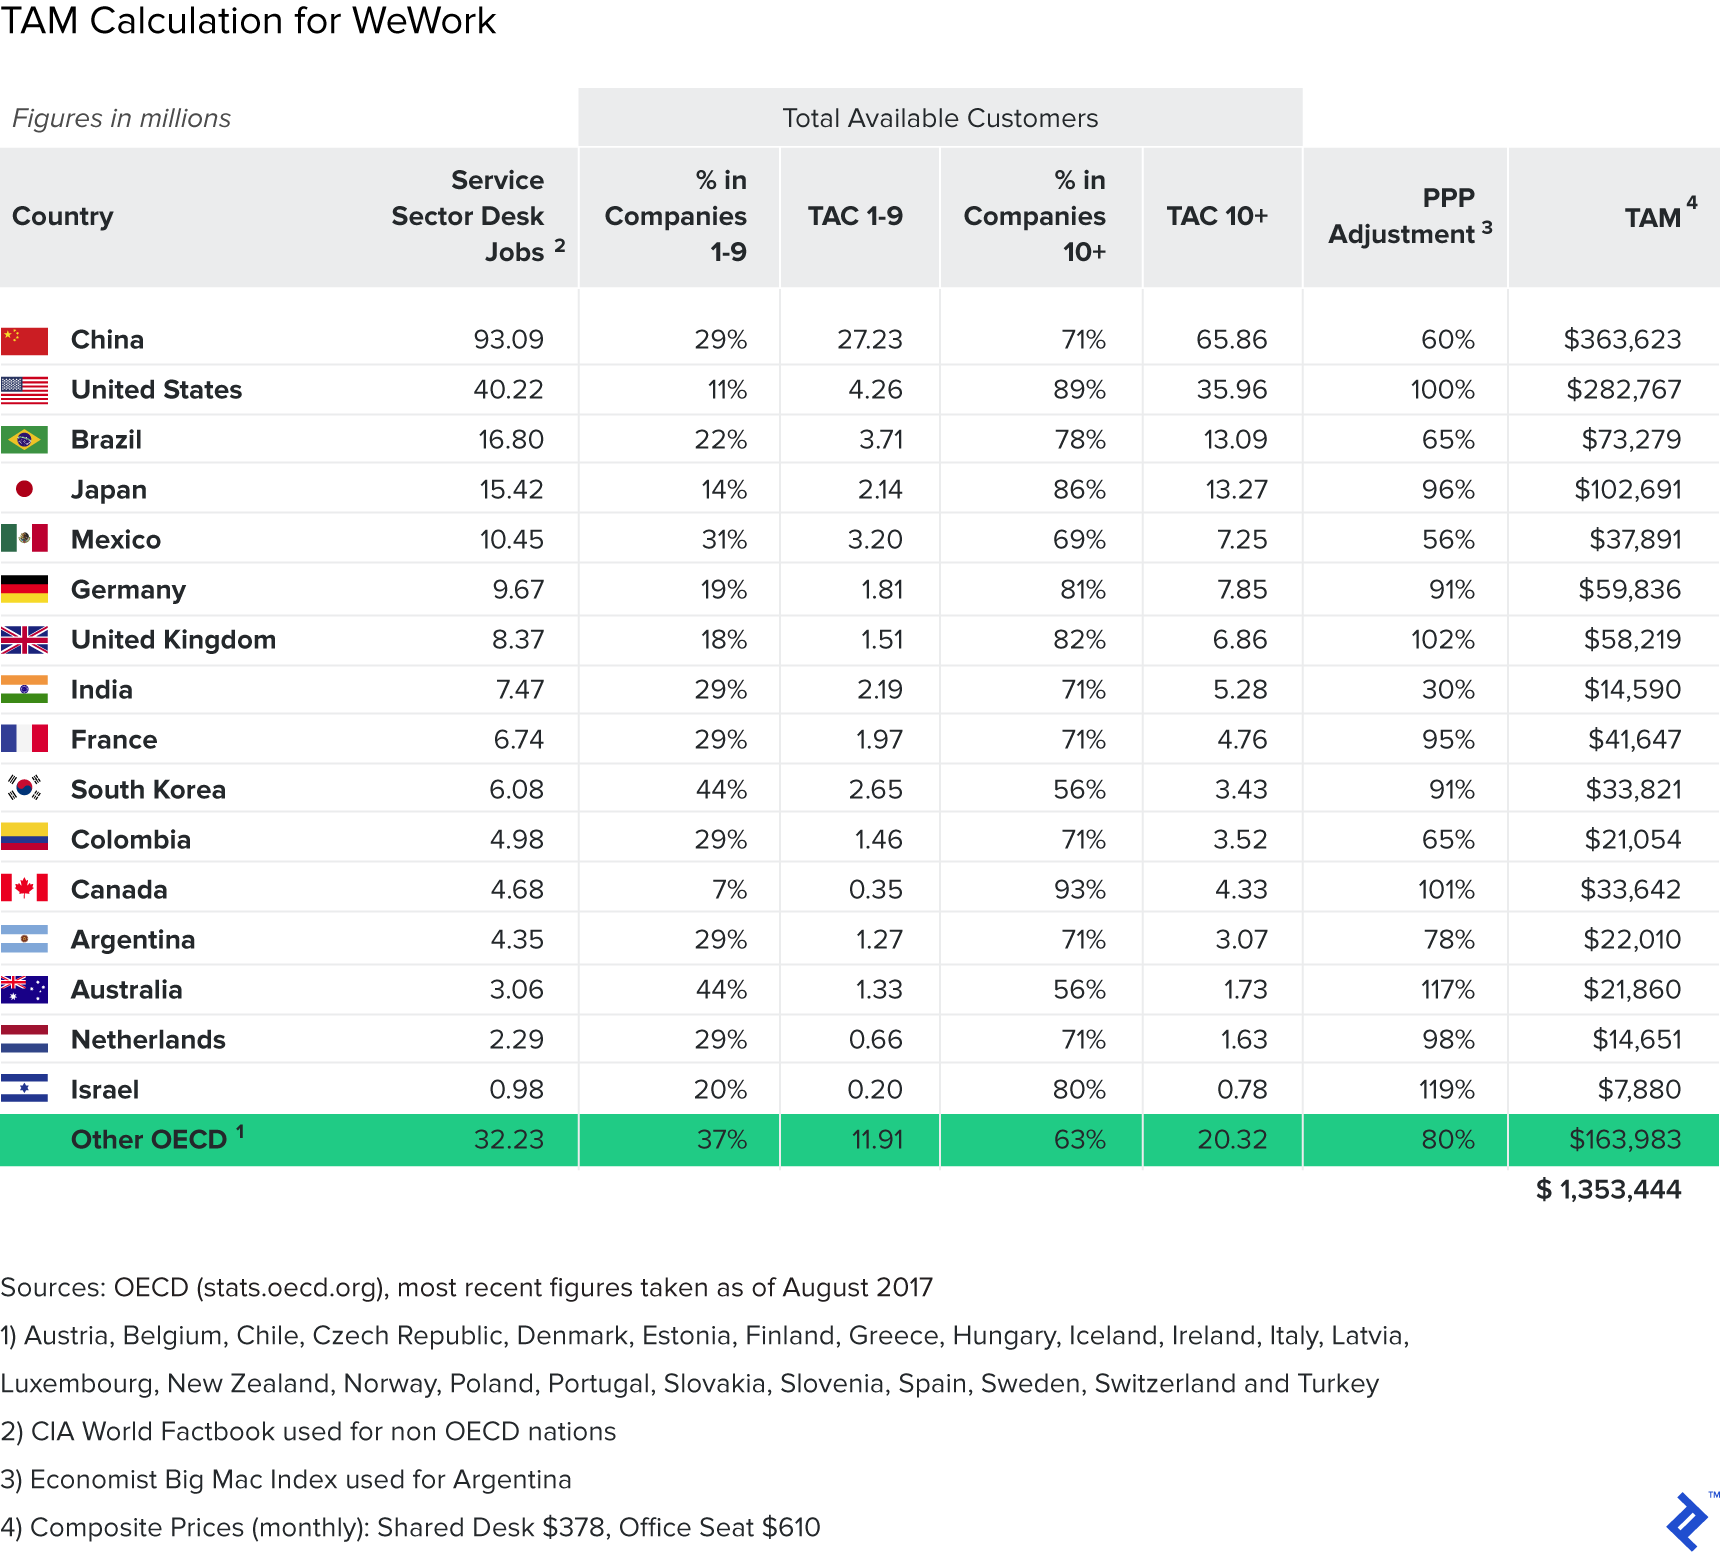
The overall TAM calculated for this set of 40 nations was $1.353 trillion, as an annual revenue opportunity.
How the Serviceable Addressable Market Is Different from TAM
The SAM splices the TAM into the portion of the market that the company is looking to actually target with its specific product/service. It is the opportunity that exists within its current capabilities and ambitions. Calculating SAM involves segmenting customers more stringently based upon what kind of offering they will deviate towards from their purchasing decisions.
For example, once upon a time, Amazon was just an online book seller. As it has grown in both scale and ambition, it has tackled more and more of the TAM of eCommerce, hence its SAM has risen. Its acquisition of WholeFoods also shows that it responds to the blurring of lines between online and brick-and-mortar commerce and delivery.
For a business to have a SAM equal to its TAM is unlikely; it would imply that it has (or wants to have) the reach and functionality to realistically service all potential customers. This mostly is not possible due to:
- Geography/Culture: Electric cars in emerging markets are a distant dream due to factors such as huge geographic mass limiting recharging bases and, in some cases, subsidized gas prices.
- Regulation: The hugely popular WhatsApp is banned in some countries.
- Cannibalization: Luxury brands cannot dilute their offering with lower priced products.
- Finite Resources: Even a benemoth like Uber couldn’t conquer the world on the ground, witnessed by its recent retreat from markets in Russia, China, and Southeast Asia.
One example of a company doing everything it can to increase its SAM is Facebook. Its Free Basics program has ancillary goals of getting more people (otherwise priced out by internet access/cost) onto Facebook.
WeWork’s SAM
First, we must define what WeWork currently is, using a quote from its website:
Workspace, Community, and Services for a Global Network of Creators

The three nouns at the start are telling, as it positions WeWork beyond just being a space for independent contractors to work. The latter two are reasons demonstrating why WeWork is actually also tackling the office environment for established companies. A look on the Enterprise section of its site shows a list of blue-chip brands that already have significant real estate assets but use WeWork for specific teams to capitalize upon the “network effects” of community and services.
Within the TAM universe for WeWork, a proportion of the market will never use coworking spaces. Some competitors like Servcorp specifically target themselves as a more “formal” alternative to WeWork to attract the skeptics. Assessing the product and distribution for WeWork gives some pointers about who it can service:
- Product: Definitely a “millennial,” social-lead, coworking environment, based on its thesis that interactions between disparate workers builds values through shared ideas and networking.
- Distribution: Global networks of creators, currently based in large, forward-thinking urban areas.
Evidently, the obvious appeal is to entrepreneurs or businesses that value those intangible benefits. The best way to segment this is to define them as the creative class. To synthetically create this subset, I would exclude from the TAM data the following:
- People who live in rural and/or disconnected areas
WeWork is a networked service that uses scale to house multiple businesses together. Outside of cities and connected urban environments, this is ineffective. Office rent is also cheaper outside of large CBDs.
- Employees working for companies greater than 250 people
I assume that WeWork is really only targeting businesses with < 250 employees. Anything more and the benefits of outsourcing office management become thinner. While large enterprise clients do use WeWork, their use cases are sporadic and idiosyncratic.
- Those without a degree
For WeWork’s TAM I used the “desk job” segment of the service industry. However, for a SAM, I narrowed that further to just employees with tertiary education.
By limiting the population to just “urban areas,” I am not restricting the SAM solely to large cities. WeWork has locations in Haifa and Be’er Sheva in Israel, metropolitan areas with populations lower than 300,000, but with thriving entrepreneurial ecosystems.
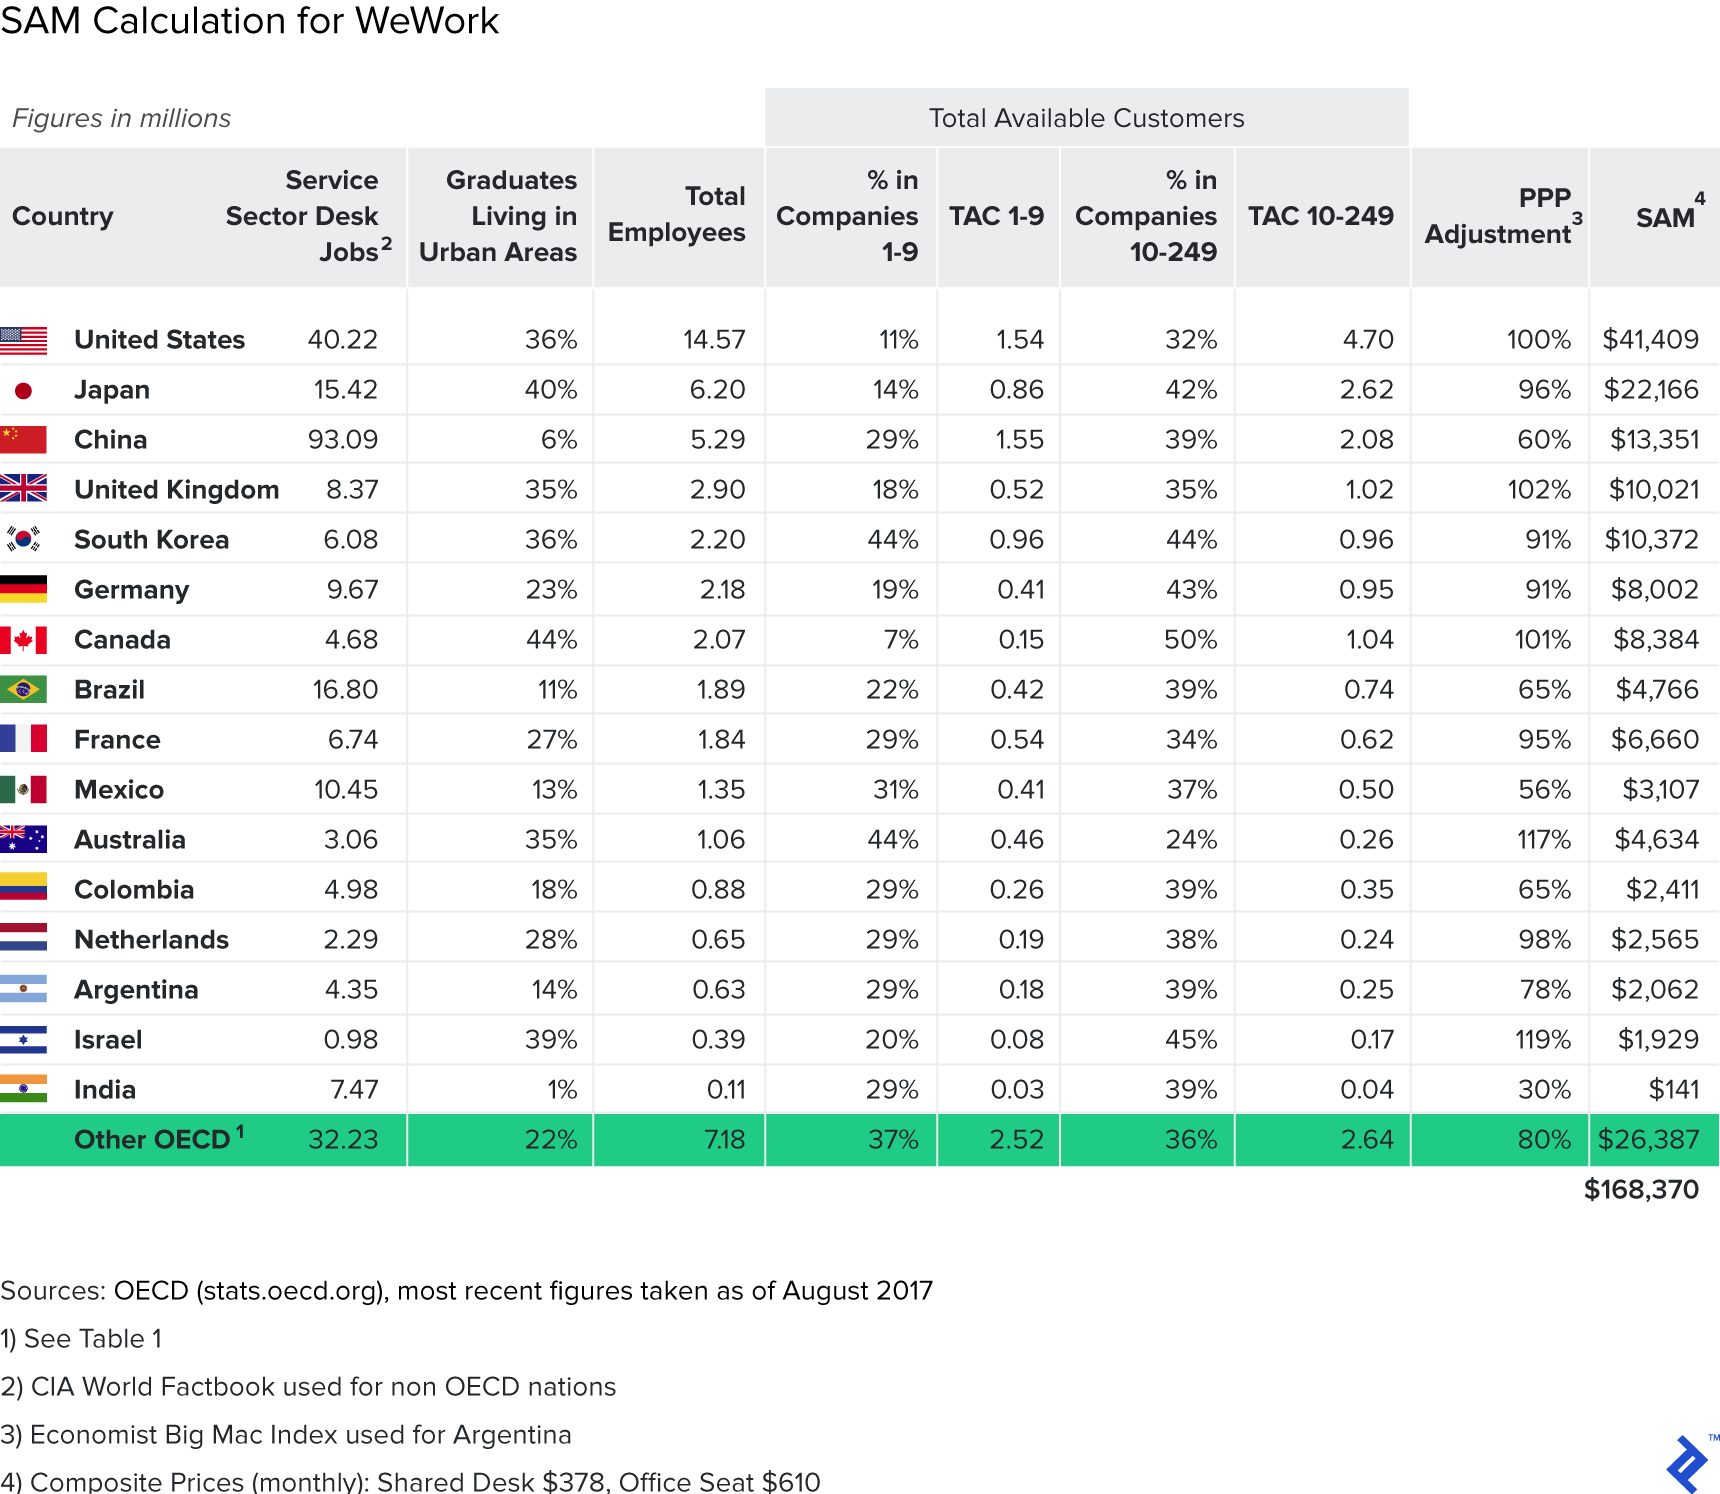
Using these figures to narrow down the TAM, WeWork currently has a SAM of $168.4 billion, 12% of its TAM.
Competitive Dynamics Affect Serviceable Obtainable Market
The final level of the analysis is the SOM, the market size that the business is realistically targeting to capture within the short term. By this point, we are appraising the resource factors and the competitive environment of the firm.
To assess resources, one must look at the financial clout of the business and its human resources. What is realistically possible in terms of responsible expansion? From a competitive landscape, this is where tried and tested methods like Porter’s Five Forces can provide insight—How tough is it to crack the market?
To come up with a SOM, I recommend either:
- Looking through historic performance and projection forecasts to look at where revenue could be in five years’ time. That will give a waypoint to target.
- Handpicking select geographies or markets from the SAM and assigning a targeted market share percentage based on local competitive environments. If it’s dominated by one player, it’s likely to have monopoloistic tendencies and projections should be facing south of 50%.
- Referring to third-party research on the sector to ascertain how market share currently stands. The more distributed, the better in terms of being able to realistically win share from others.
WeWork’s SOM
The countries in the SAM are all rational choices for WeWork to locate, but to narrow its focus to obtainable and priority markets, I reduced the list. I removed all countries that WeWork was currently not in that had a potential customer base of less than 1 million people. Subsequently, the only country that remained post-cull that was not already served was Spain. 23 countries were eliminated, which dented the SAM figure by $21.8 billion.
Looking at the competitive environment of WeWork, I see four groups of competition that exist to either attract current coworking members or convert workers from other habitats:
- Other shared office providers (e.g., Regus) and rival coworking places (e.g., Impact Hub)
- Private office rental, or remaining in employers’ traditional offices
- Coffee shops, cafes, libraries, and other free “work-friendly” places
- Working from home
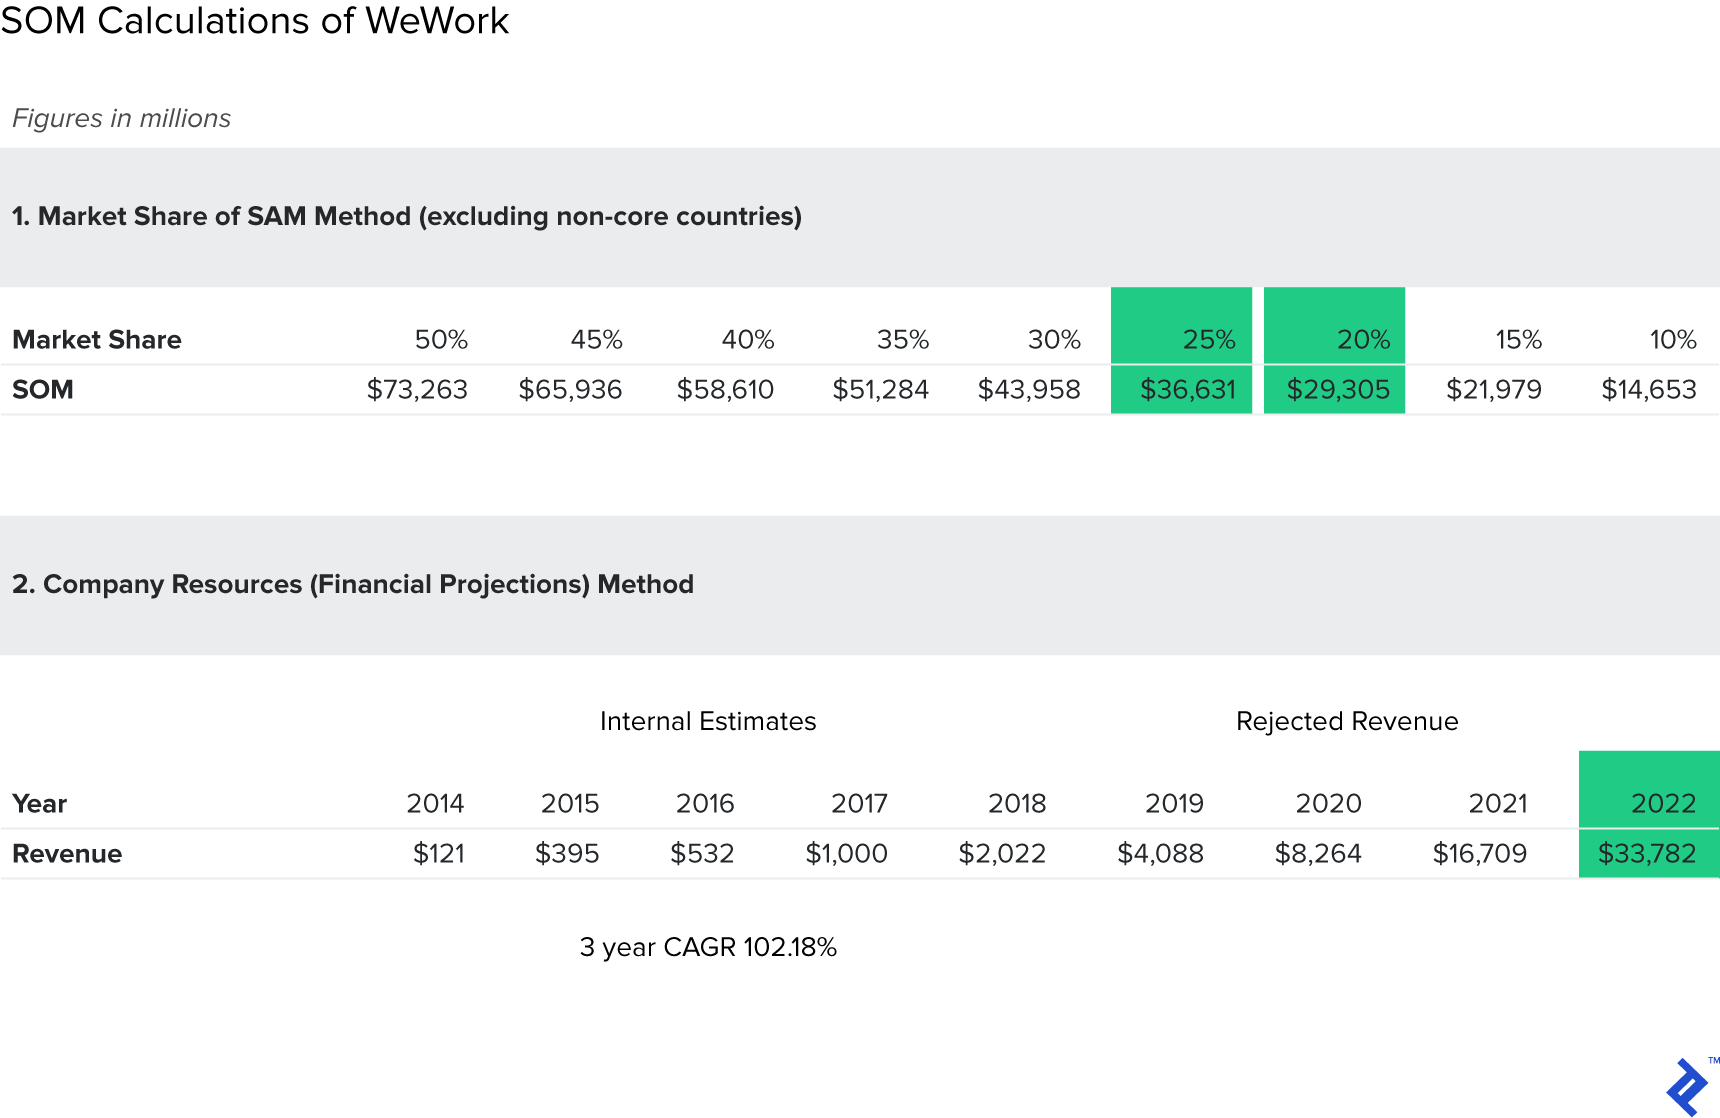
Assigning market share between all the players here is incredibly subjective. However, one insight suggests that in 2016 WeWork leased 64% of newly available coworking space in the USA, compared to its peers. A statistic that shows that it is gaining market share aggressively.
Assuming that each segment of the “competition” has 25% of the market, I would apportion that WeWork’s SOM would equal that number too. Why? Because as the leasing stats show, it is vigorously tackling this market already and with any market share that competitors do not cede, it is likely that WeWork will convert new users from the other segments. Therefore, the SOM from the abridged SAM list would be $36.6 billion.
To sense check this, I used WeWork’s own financials to come up with a realistic expectation of where its revenue could be in five years’ time. Piecing together stories, leaks, and disclosures, I saw that over the past three years it had a CAGR of 102% between 2014 and the projected $1 billion of revenue for 2017. Its revenue is doubling every year, and on that logic, a conservative estimate for its revenue in five years’ time would be $33.8 billion. This corroborates (<$3 billion difference) with the SOM that I calculated from the competitive landscape.
Some may say that WeWork’s growth should scale faster, but whether WeWork is a truly scalable business is a debate for another time. With various efforts to employ technology, use leases, and attract higher-paying enterprise clients, the business certainly is trying.
The average of the two SOM points is $35.2 billion, representing 20.9% of the total SAM.
A TAM Exercise Can Prove or Refute Preconceptions
This analysis makes a pre-money $20 billion valuation of the business appear both palatable and logical. What is clear though is that WeWork is tackling a huge market and the traction it has received demonstrates that it is doing a strong job and earning market share. Investors have bought into this.
Going into this article, my personal feelings about WeWork were quite muted. It struck me more as an opportunistic play, arbitraging property costs to over-indulged customers, without any clear deployment of scalable technology. Working through its TAM, SAM, and SOM piqued my interest and tangibly highlighted to me the immense opportunity that the business has. I feel that at $20 billion, WeWork could actually be undervalued, if its revenue continues to double each year from servicing its vast SAM. With a lease-based business model and gross margins over 60% in some markets, it could really grow into a machine of free cash flow, which will accelerate growth further.
Considering the head start that the incumbent Regus had; it proclaims “3,000 locations in 120 countries.” WeWork is clearly doing something right. If WeWork hits revenue targets of $1 billion in 2017, it will represent 1/3 of Regus’ 2016 sales. But with just 211 locations, WeWork has a far higher take per venue. Under the hood, this suggests ways in which perhaps technology is playing a greater hand, either through better market intelligence or collaboration/social tools that provide utility (and thus, revenue opportunities) from its users.
Under the hood, this suggests ways in which perhaps technology is playing a greater hand in WeWork’s success over brick and mortar enterprises because its playbook is now so refined it offers consulting services to other businesses to help them create collaborative workplace environments. Its recent acquisition patterns further demonstrated its expansionist moves into all kinds of areas within the construction, work, and social interaction stacks.
TAM, SAM, and SOM Is a Vital Exercise, If Done Correctly
Total addressable market is often misused. It’s often calculated incorrectly (either too aggressively or conservatively) and then implied to assume a realistic benchmark for budgeted revenue. Often a TAM of around $1 trillion will magically appear with an arbitrary 1% of targeted market share attached and then, voila! Revenues of $10 billion will appear overnight. This is why investors can feel both misled and skeptical about the figures that they see.
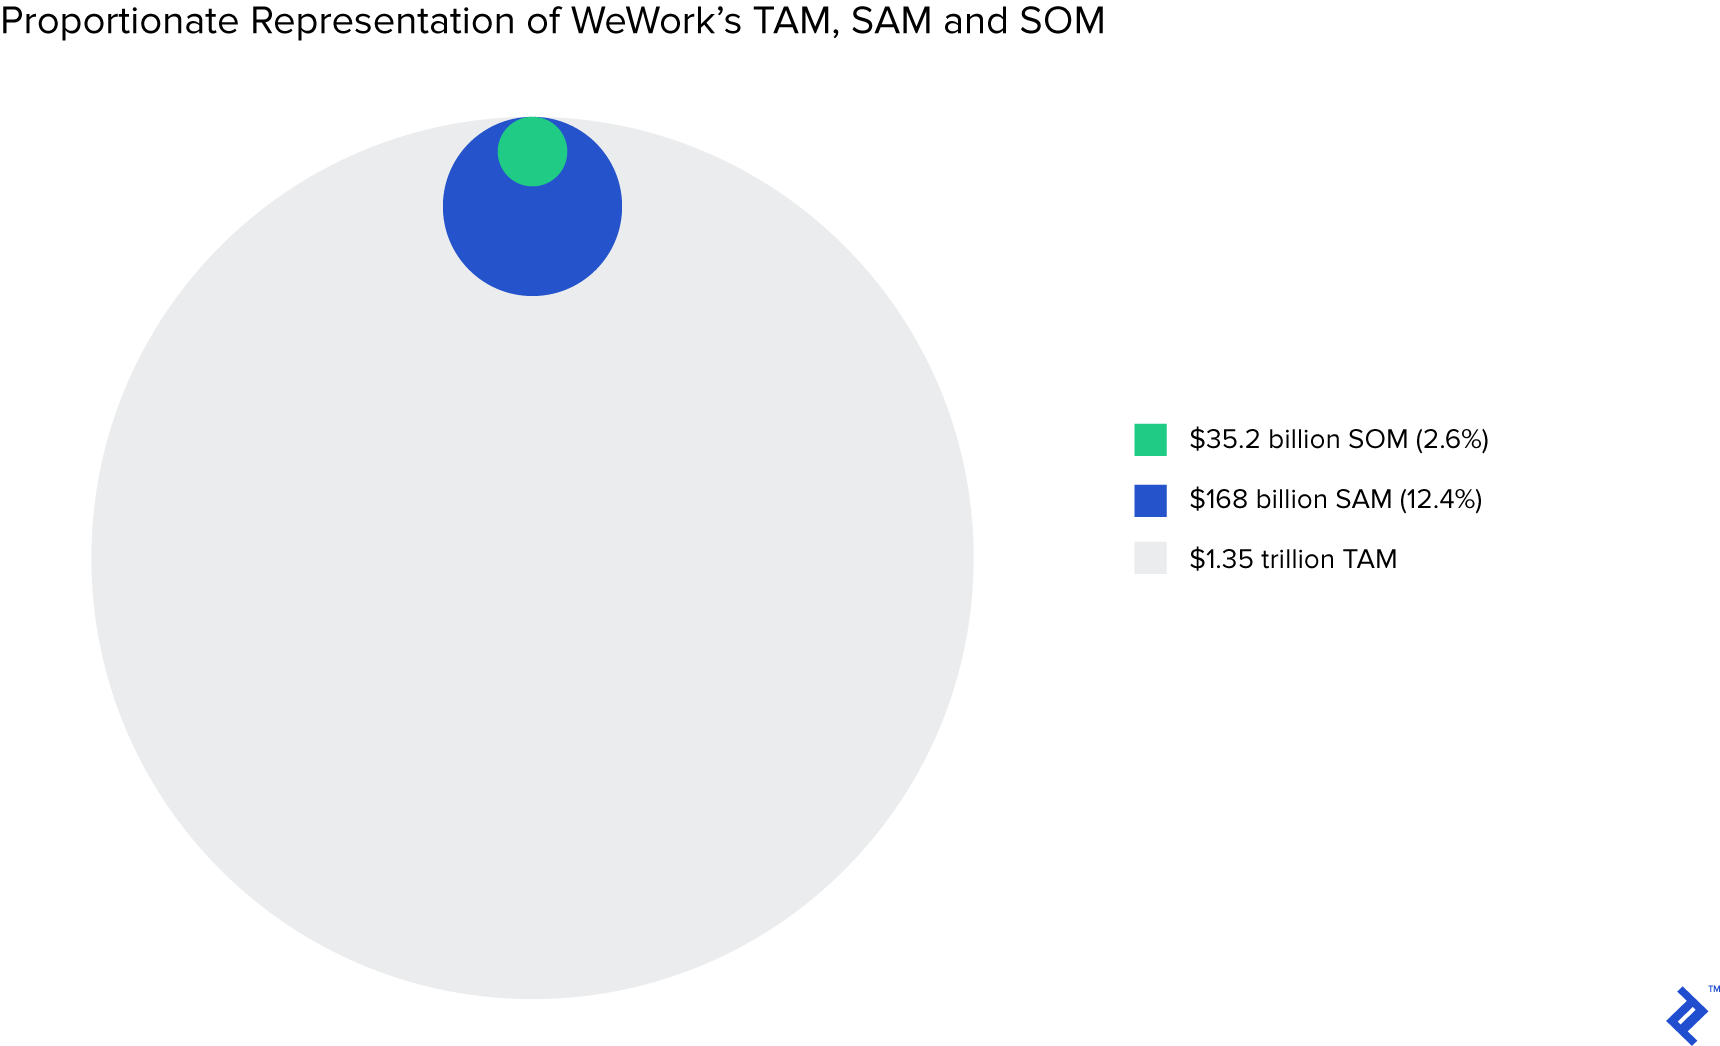
Working through the total addressable market, serviceable available market and serviceable obtainable market will allow both entrepreneurs and investors to see a truer sense of what the business is trying to do and make far more accurate mental maps about the competitive dynamics. We see with WeWork that its SAM is 12.4% of its TAM and similarly, its SOM is 2.6%. The large difference between the TAM and SAM and then the smaller difference between SAM and SOM demonstrates pertinent aspects of its business:
- It’s tackling a huge market with an offering that in the medium term will only appeal to a niche
- Within this niche, it has already got legs and is already a major player
If doing this exercise on WeWork had an enlightening effect on me of switching my opinion about the business, imagine the value that this exercise could have on an entrepreneur about to found a business.